Fig. 4.
Download original image
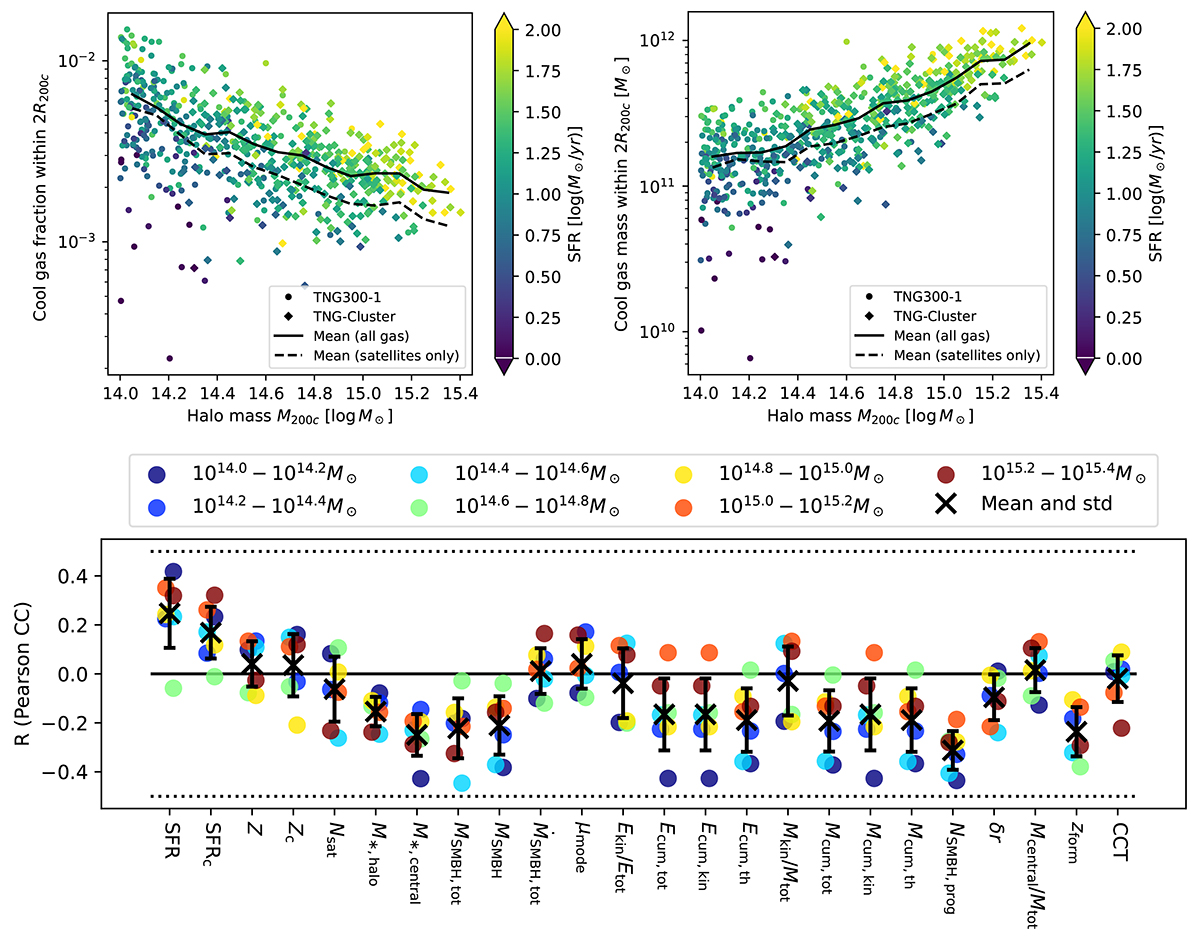
Abundance of cool gas in galaxy clusters at z = 0 according to the TNG300 and TNG-Cluster simulations. Top: Cool (T < 104.5 K) to total gas mass fraction (left) and cool gas mass (right) as a function of cluster mass M200c. All gas within 2R200c from the cluster center is considered, hence including both ICM as well as satellite gas. The circles (diamonds) show TNG300 (TNG-Cluster) halos at z = 0, colored by the total star formation rate of the halo, a measure of the ongoing SF activity in both the central and satellite galaxies. The solid black lines show the running average of cool gas mass fraction and cool gas mass respectively, while the dashed black lines show the running average only for gas in satellites within 2R200c, regardless of host halo. Bottom: Pearson correlation coefficient between cool gas fraction within 2R200c and a number of selected cluster properties (listed in detail in Table 1), in seven mass bins of 0.2 dex depicted by colored dots. The points have been given small horizontal shifts for visual clarity. The black crosses mark the mean correlation coefficient over all mass bins, including error bars for standard deviation. The black dotted lines mark the position of R = 0.5 and −0.5 respectively. A large fraction of cool gas within 2R200c is gravitationally bound to satellite galaxies, and its mass fraction weakly correlates with multiple properties of the cluster.
Current usage metrics show cumulative count of Article Views (full-text article views including HTML views, PDF and ePub downloads, according to the available data) and Abstracts Views on Vision4Press platform.
Data correspond to usage on the plateform after 2015. The current usage metrics is available 48-96 hours after online publication and is updated daily on week days.
Initial download of the metrics may take a while.