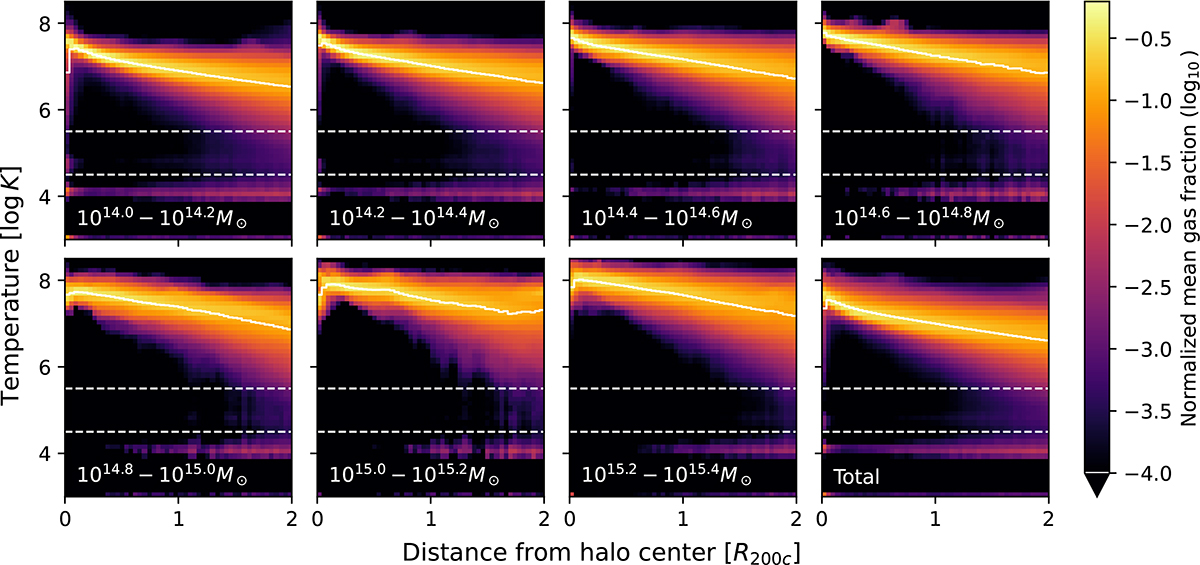
Fig. 6.
Download original image
Mean radial temperature distribution of all clusters in TNG300 and TNG-Cluster at z = 0. The color of each pixel shows the mean gas mass at that temperature and distance, averaging over all clusters in seven mass bins of 0.2 dex (first seven panels, bin range denoted in bottom left of every panel), plus the total mean profile over all clusters (final panel). Each panel is then normalized, giving fractions. The white solid lines show the running temperature average, the white dashed lines show the division between temperature regimes. The profiles are normalized such that in each distance bin, the values across all temperature bins sums to unity. Cool gas is predominantly located in the outskirts and the center of clusters.
Current usage metrics show cumulative count of Article Views (full-text article views including HTML views, PDF and ePub downloads, according to the available data) and Abstracts Views on Vision4Press platform.
Data correspond to usage on the plateform after 2015. The current usage metrics is available 48-96 hours after online publication and is updated daily on week days.
Initial download of the metrics may take a while.