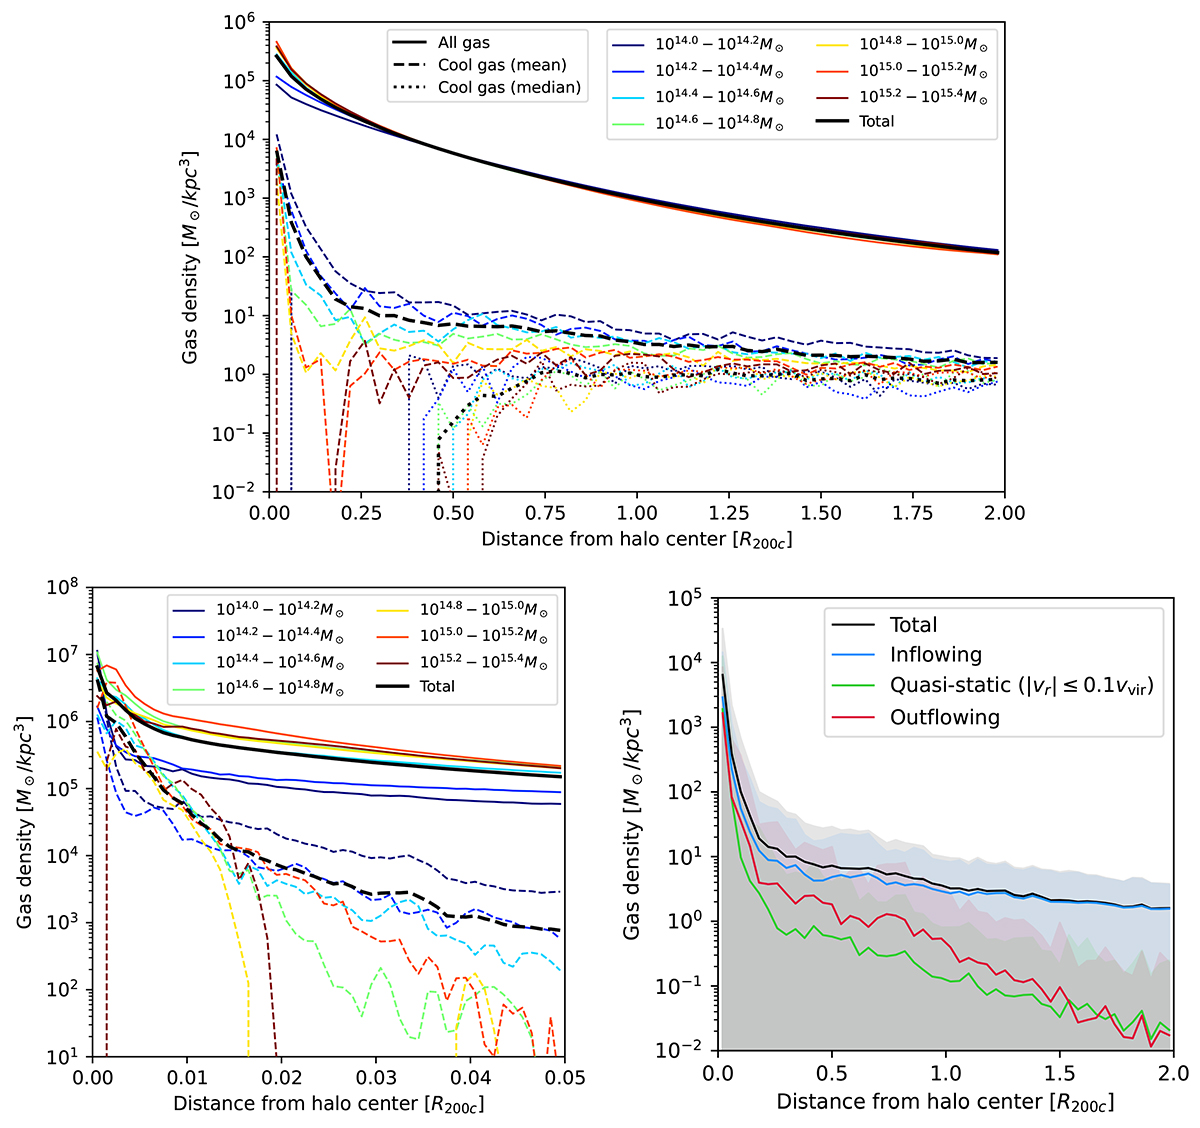
Fig. 8.
Download original image
Gas density profiles of clusters in TNG300 and TNG-Cluster at z = 0 for gas in different temperature phases and with different radial velocities. Top: Gas density profile out to 2R200c computed in radial shells of thickness 0.04R200c. The solid lines show the mean total gas density whereas the dashed (dotted) lines show the mean (median) density of only the cool gas (T < 104.5K). The black line shows the mean across the entire sample of clusters, while the colored lines show the mean in mass bins of 0.2 dex. Bottom left: Same as top but only out to 0.05R200c and computed in radial shells of thickness 10−3R200c. Bottom right: Density profile of cool gas for all clusters split by the radial velocity of the gas. Lines show the mean density profile for cool gas of all clusters for all cool gas (black line), inflowing cool gas (blue), quasi-static cool gas (green) and outflowing cool gas (red). Gas is considered inflowing (outflowing) if its radial velocity is toward (away from) the cluster center, and quasi-static if its absolute radial velocity is below 10% of the cluster virial velocity. The shaded regions show the standard deviation. Cool gas has lower average density than the overall cluster gas and is predominantly inflowing into the cluster, except in the cluster center.
Current usage metrics show cumulative count of Article Views (full-text article views including HTML views, PDF and ePub downloads, according to the available data) and Abstracts Views on Vision4Press platform.
Data correspond to usage on the plateform after 2015. The current usage metrics is available 48-96 hours after online publication and is updated daily on week days.
Initial download of the metrics may take a while.