Open Access
Fig. 1
Download original image
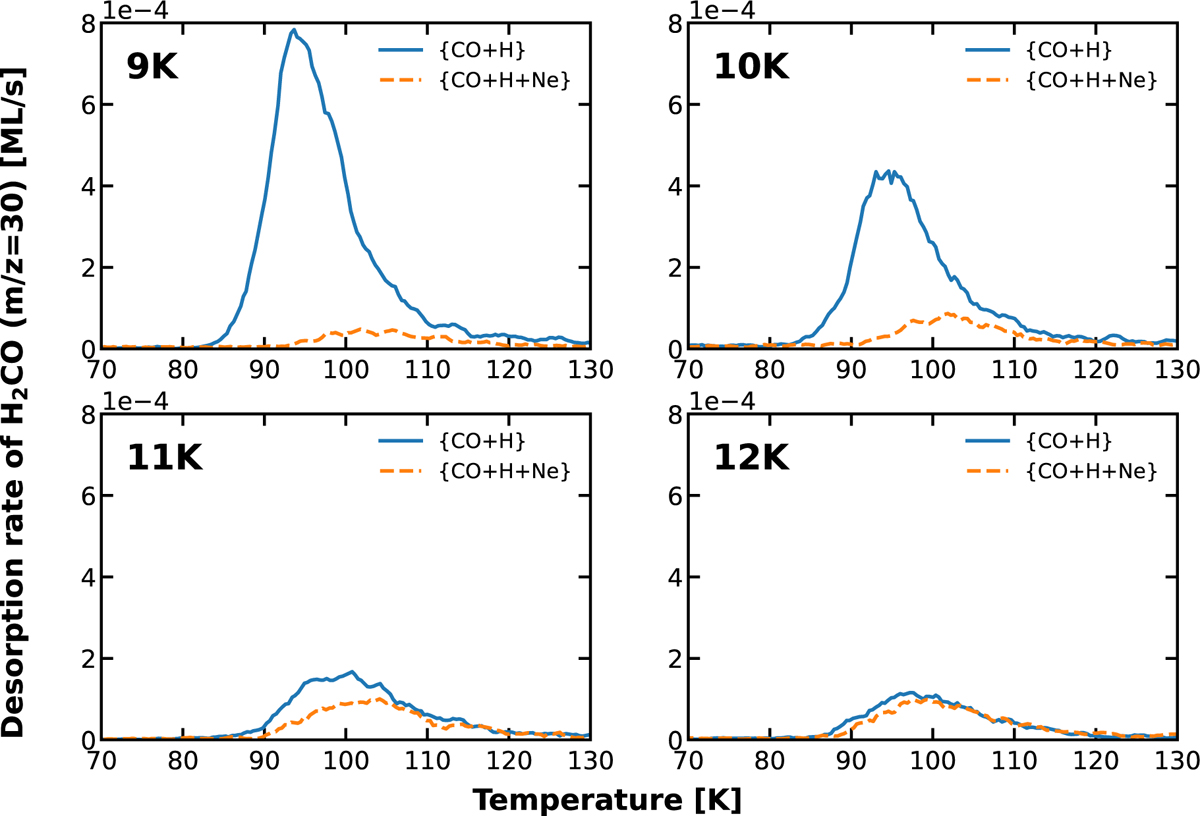
TPD curves for H2CO (m/z=30) on a gold substrate at four different temperatures: 9, 10, 11 and 12 K. The blue line represents the codeposition of CO and H, and the dashed orange line represents the co-deposition of CO, H, and Ne.
Current usage metrics show cumulative count of Article Views (full-text article views including HTML views, PDF and ePub downloads, according to the available data) and Abstracts Views on Vision4Press platform.
Data correspond to usage on the plateform after 2015. The current usage metrics is available 48-96 hours after online publication and is updated daily on week days.
Initial download of the metrics may take a while.