Open Access
Fig. C.3
Download original image
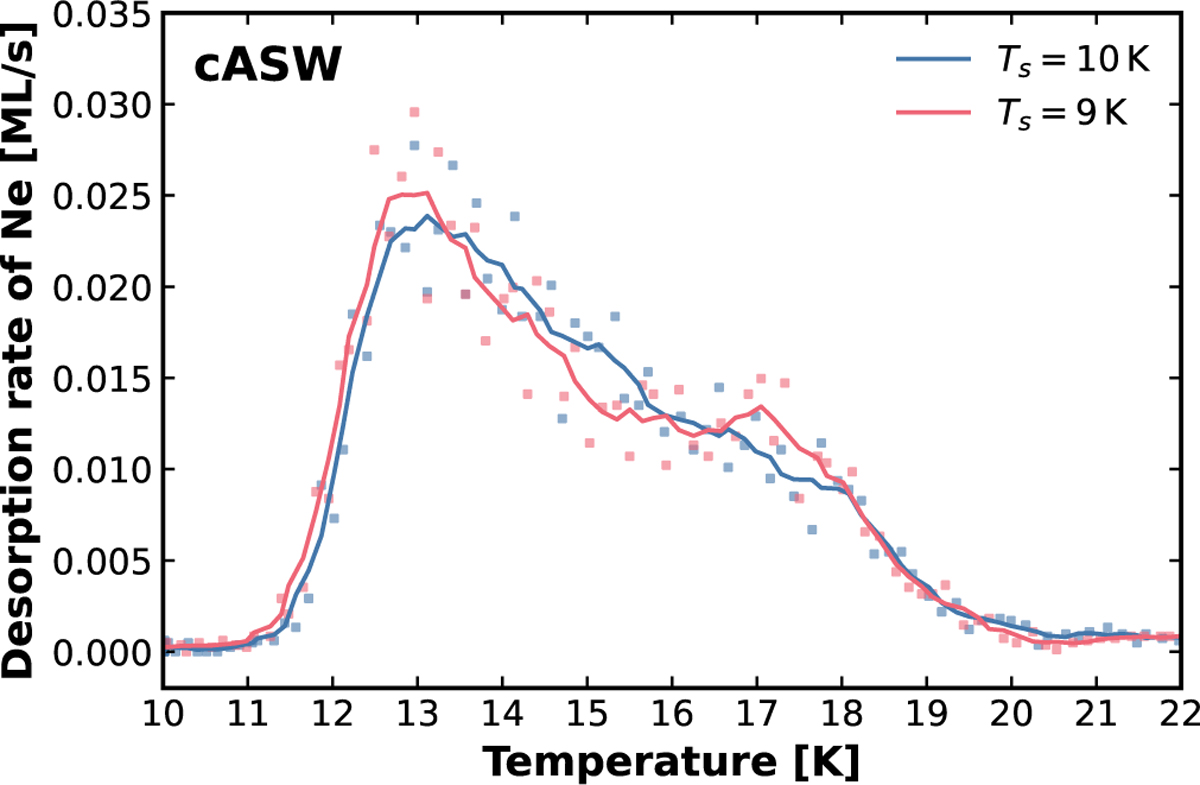
TPD curves of Ne (m/z = 20) for a surface coverage of 0.71 ML on cASW substrate. The blue TPD curve represent a surface temperature during the deposition at 10 K and 9 K for the red TPD curve.
Current usage metrics show cumulative count of Article Views (full-text article views including HTML views, PDF and ePub downloads, according to the available data) and Abstracts Views on Vision4Press platform.
Data correspond to usage on the plateform after 2015. The current usage metrics is available 48-96 hours after online publication and is updated daily on week days.
Initial download of the metrics may take a while.