Open Access
Fig. B.1
Download original image
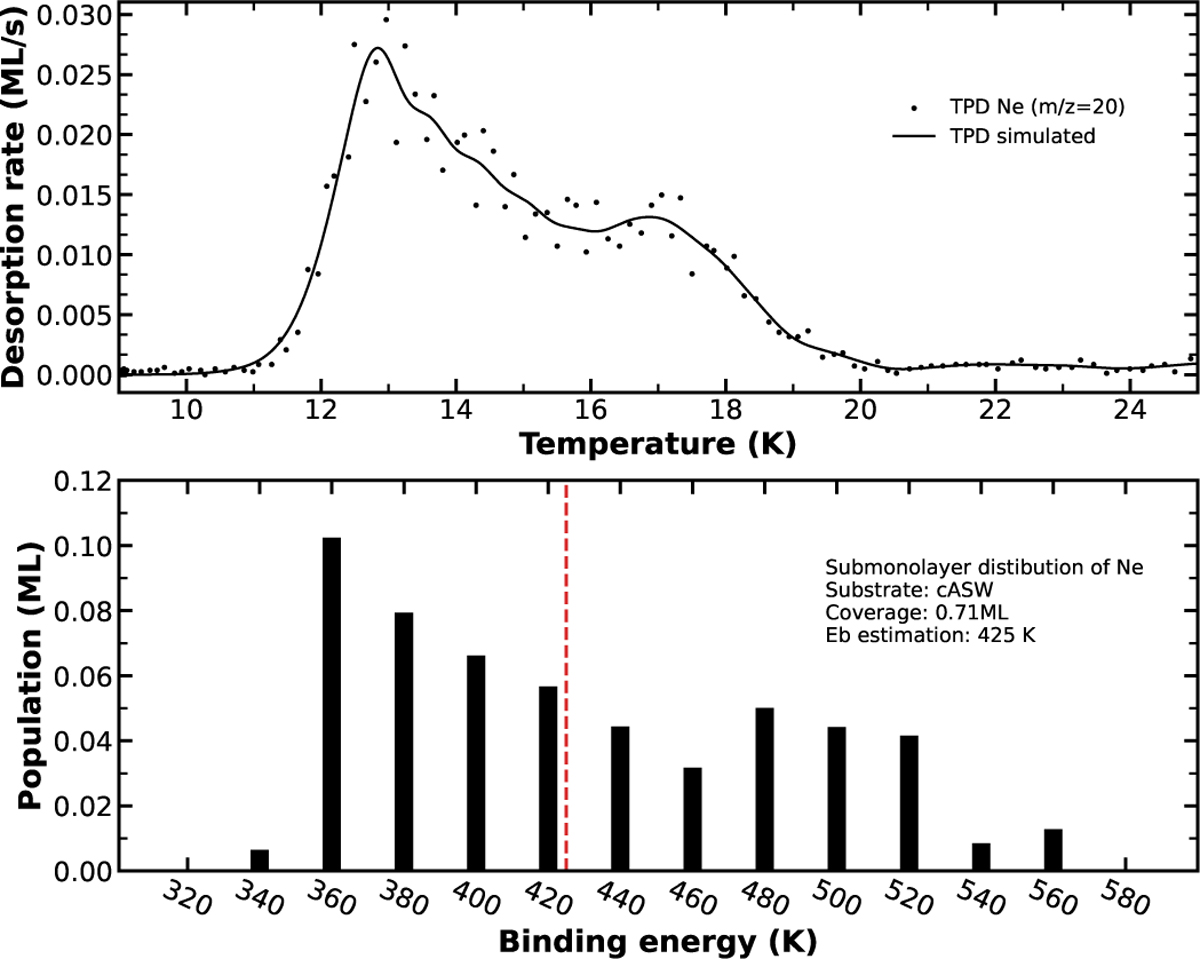
Distribution of Ne on a cASW substrate with a surface temperature at 9 K during the deposition. The top panel represents a TPD spectrum of Ne (m/z=20) in black dots and a TPD simulated in black line. The bottom panel represents the distribution of binding energies of Ne on the cASW substrate.
Current usage metrics show cumulative count of Article Views (full-text article views including HTML views, PDF and ePub downloads, according to the available data) and Abstracts Views on Vision4Press platform.
Data correspond to usage on the plateform after 2015. The current usage metrics is available 48-96 hours after online publication and is updated daily on week days.
Initial download of the metrics may take a while.