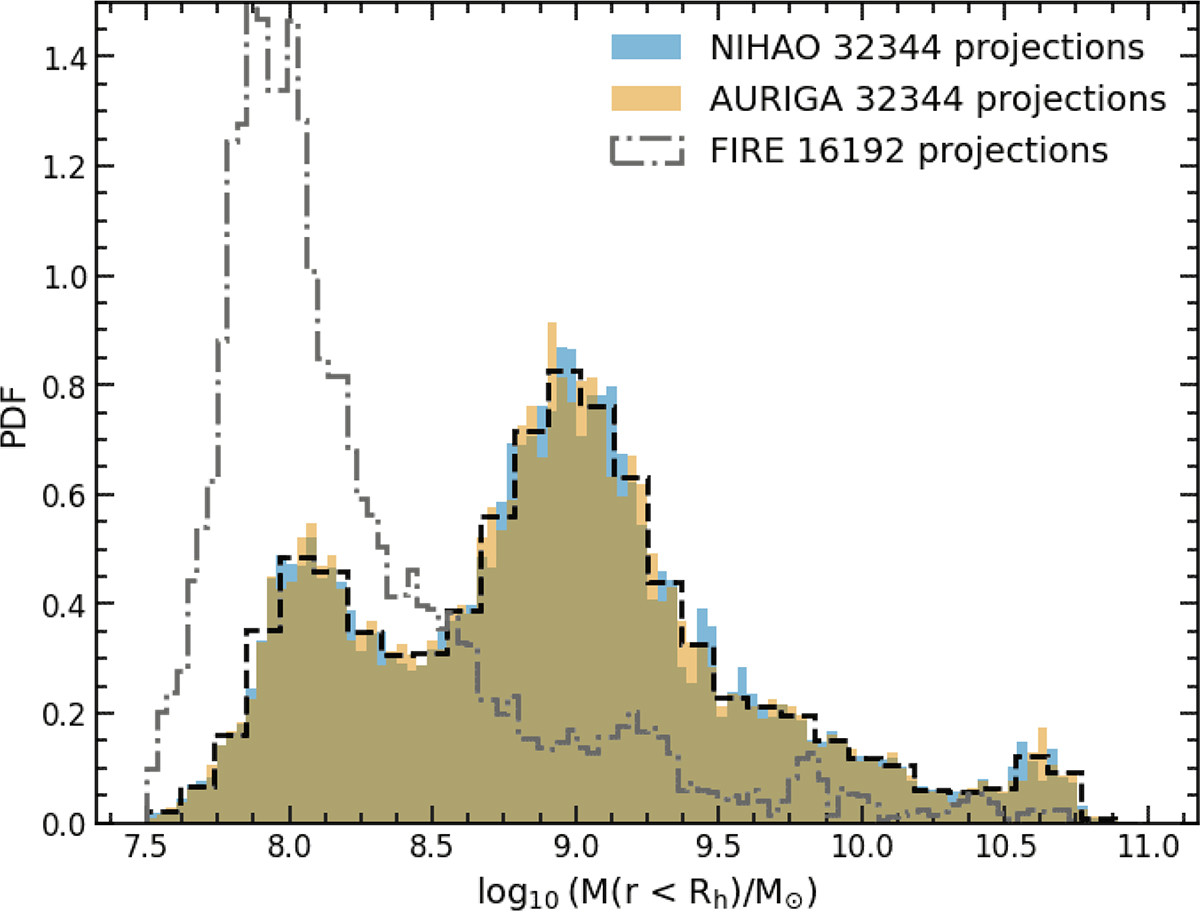
Fig. 1.
Download original image
Distribution of dynamical mass enclosed within the projected half-light radius (Rh) of dispersion-supported galaxies for each suite of simulations. Blue and orange histograms show, respectively, the distributions of NIHAO and AURIGA galaxy projections with 100 bins, while the dashed black line histogram shows their distribution at 30 bins, which we made equal in the two suites by dropping excessive projections from each dataset. The dashed grey lines show the distribution of FIRE galaxy projections inside the mass range covered by NIHAO and AURIGA.
Current usage metrics show cumulative count of Article Views (full-text article views including HTML views, PDF and ePub downloads, according to the available data) and Abstracts Views on Vision4Press platform.
Data correspond to usage on the plateform after 2015. The current usage metrics is available 48-96 hours after online publication and is updated daily on week days.
Initial download of the metrics may take a while.