Fig. 10.
Download original image
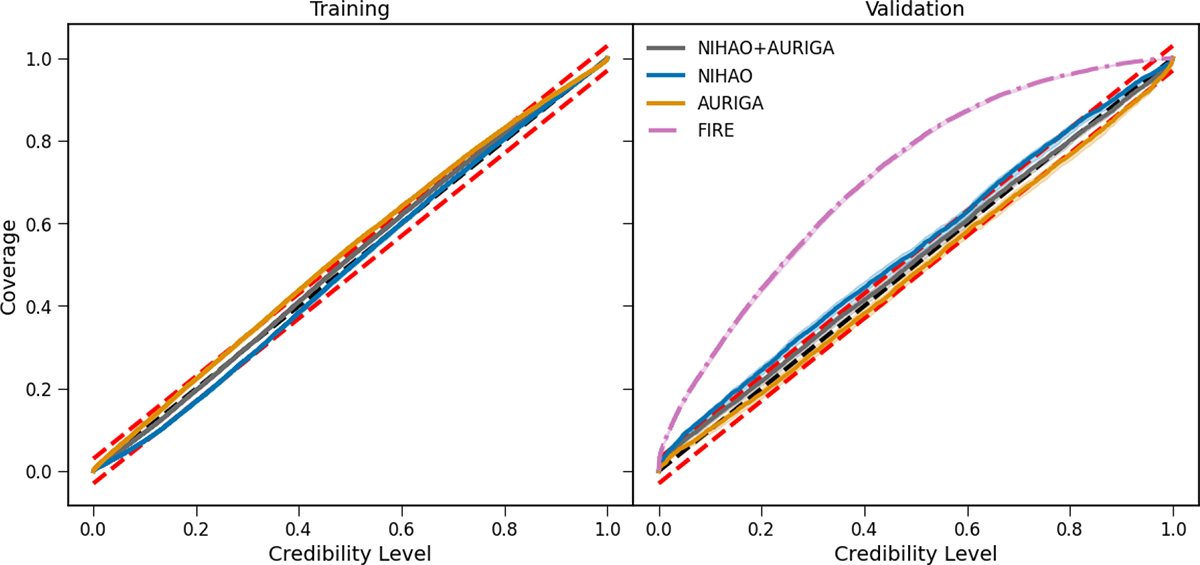
TARP multivariate coverage test for the training set (left panel) and validation set (right panel) of the model trained on NIHAO and AURIGA galaxies together. We show in different colours the results of the test for galaxy projections corresponding to NIHAO and AURIGA suites in each dataset. Additionally, we plot the results of the test applied to FIRE galaxies in the right panel. The dashed black lines show the expected result for a perfect calibration of the posterior, where a probability distribution contains the ground truth value within a given confidence interval with the expected frequency. Dashed red lines mark regions with a 3% deviation from the expected statistical coverage. Solid coloured lines show the median result of the test on a subset of galaxy projections after 100 bootstrapping iterations. Shadowed regions contain the 2σ dispersion interval.
Current usage metrics show cumulative count of Article Views (full-text article views including HTML views, PDF and ePub downloads, according to the available data) and Abstracts Views on Vision4Press platform.
Data correspond to usage on the plateform after 2015. The current usage metrics is available 48-96 hours after online publication and is updated daily on week days.
Initial download of the metrics may take a while.