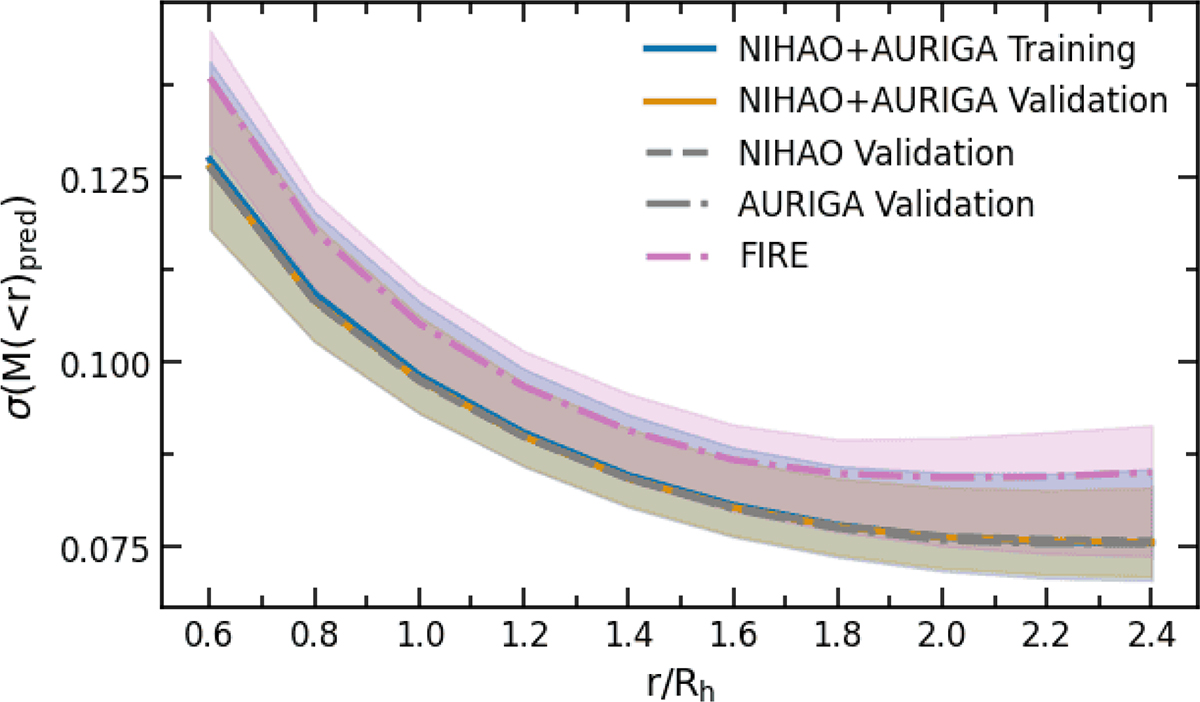
Fig. D.2.
Download original image
Uncertainty of the mass enclosed within different radii of the galaxies in the training set and in the validation set of the model trained on NIHAO and AURIGA galaxies together. The blue (orange) line shows the median uncertainty for the training (validation) set, while the shadowed region indicates the 1σ interval. The median uncertainty of NIHAO and AURIGA galaxies in the validation set is individually shown as a dashed and dot-dashed grey line, respectively. The dotted pink line and shadowed region correspond to the FIRE testing set.
Current usage metrics show cumulative count of Article Views (full-text article views including HTML views, PDF and ePub downloads, according to the available data) and Abstracts Views on Vision4Press platform.
Data correspond to usage on the plateform after 2015. The current usage metrics is available 48-96 hours after online publication and is updated daily on week days.
Initial download of the metrics may take a while.