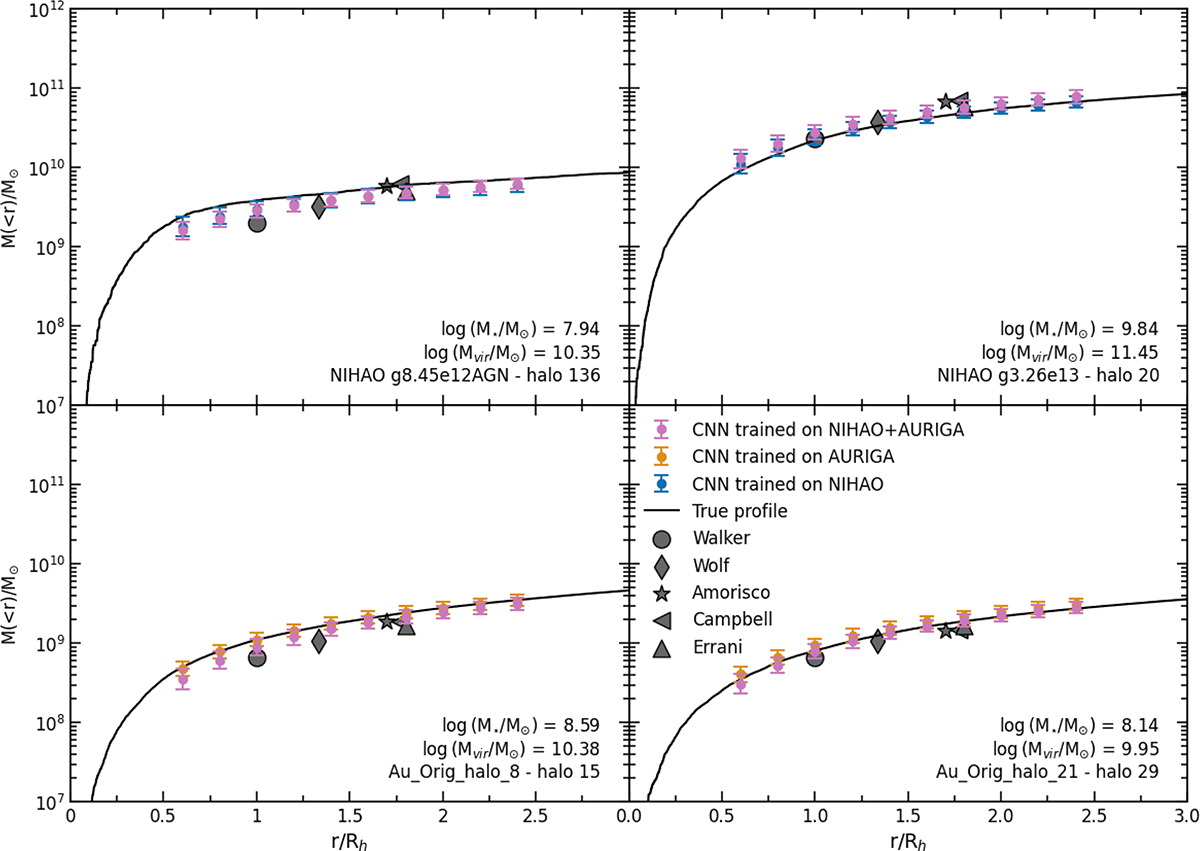
Fig. 5.
Download original image
CNN+MAF and mass estimator predictions for four random projections of four different galaxies in the validation set. Numerical profiles of cumulative mass calculated from the simulations are plotted as solid black lines, with CNN+MAF predictions shown as circles with their corresponding 1σ uncertainties, and mass estimator calculations displayed as grey markers with black edges. The colour of the CNN+MAF circle markers varies depending on the dataset on which the model has been trained. Each panel is labelled with the identifier of the galaxy whose results are plotted in it, specifying the simulation suite, name, and number of the halo in our halo finder. We show full posterior distributions of the CNN+MAF predictions in Fig. B.1.
Current usage metrics show cumulative count of Article Views (full-text article views including HTML views, PDF and ePub downloads, according to the available data) and Abstracts Views on Vision4Press platform.
Data correspond to usage on the plateform after 2015. The current usage metrics is available 48-96 hours after online publication and is updated daily on week days.
Initial download of the metrics may take a while.