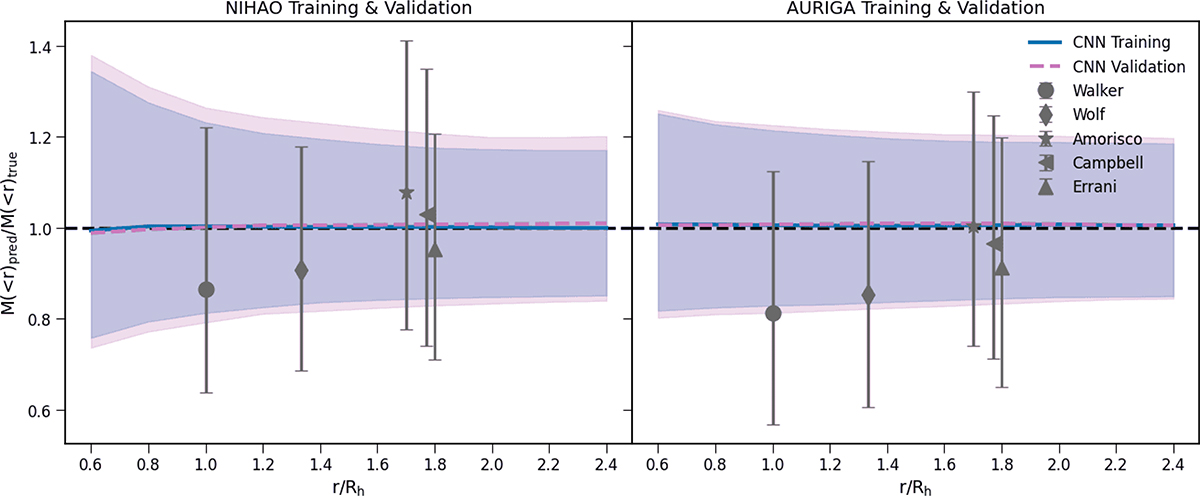
Fig. 6.
Download original image
Ratio between the mass predicted by the CNN+MAF model and the true mass enclosed within different radii of the galaxies in the training and validation sets of NIHAO (left panel) and AURIGA (right panel) datasets. The blue line shows the median ratio determined using the mass estimated by the CNN+MAF for the training set, while the shadowed region indicates the 1σ dispersion. The pink line and shadowed region correspond to CNN+MAF predictions for the validation set. The predicted versus true mass ratios resulting from applying literature mass estimators to either NIHAO (left panel) or AURIGA (right panel) galaxies are shown as grey symbols with 1σ error bars.
Current usage metrics show cumulative count of Article Views (full-text article views including HTML views, PDF and ePub downloads, according to the available data) and Abstracts Views on Vision4Press platform.
Data correspond to usage on the plateform after 2015. The current usage metrics is available 48-96 hours after online publication and is updated daily on week days.
Initial download of the metrics may take a while.