Fig. 10
Download original image
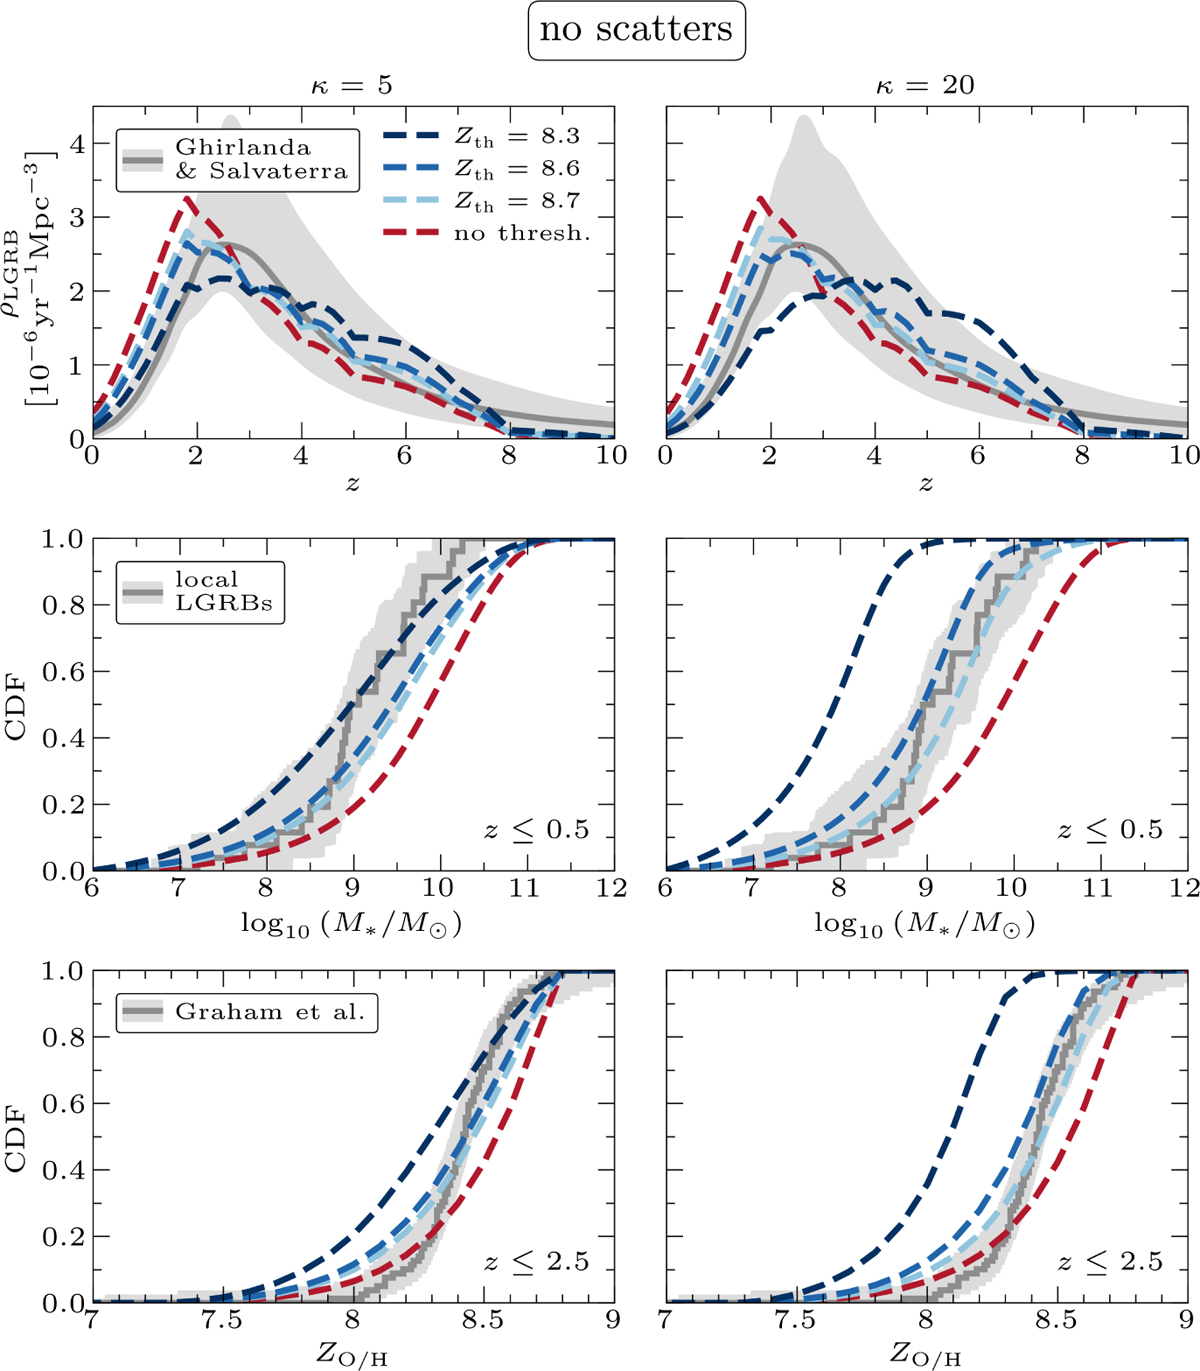
Resulting distributions when removing the scatters from our model, for Zth = 8.3, 8.6, and 8.7 as well as no threshold at all (dark blue, blue, light blue, and red, respectively) and κ = 5 and 20 (left and right column, respectively), similar to Fig. 7 but with slightly different values of Zth. The red line with no implemented threshold traces the SFR distribution. In the top row we compare the RLGRB distributions for the different variations with the results of Ghirlanda & Salvaterra (2022). In the middle row, we show the cumulative distributions of our results for z ≤ 0.5 together with the cumulative distribution of the local LGRB host masses (as listed in Appendix A). The bottom row, in turn, shows the cumulative metallicity distributions for z ≤ 2.5 compared to the C17 results of Graham et al. (2023). The 95% confidence intervals in the last two rows (bootstrapped and scattered as described in Sect. 3) are shown through the light grey areas.
Current usage metrics show cumulative count of Article Views (full-text article views including HTML views, PDF and ePub downloads, according to the available data) and Abstracts Views on Vision4Press platform.
Data correspond to usage on the plateform after 2015. The current usage metrics is available 48-96 hours after online publication and is updated daily on week days.
Initial download of the metrics may take a while.