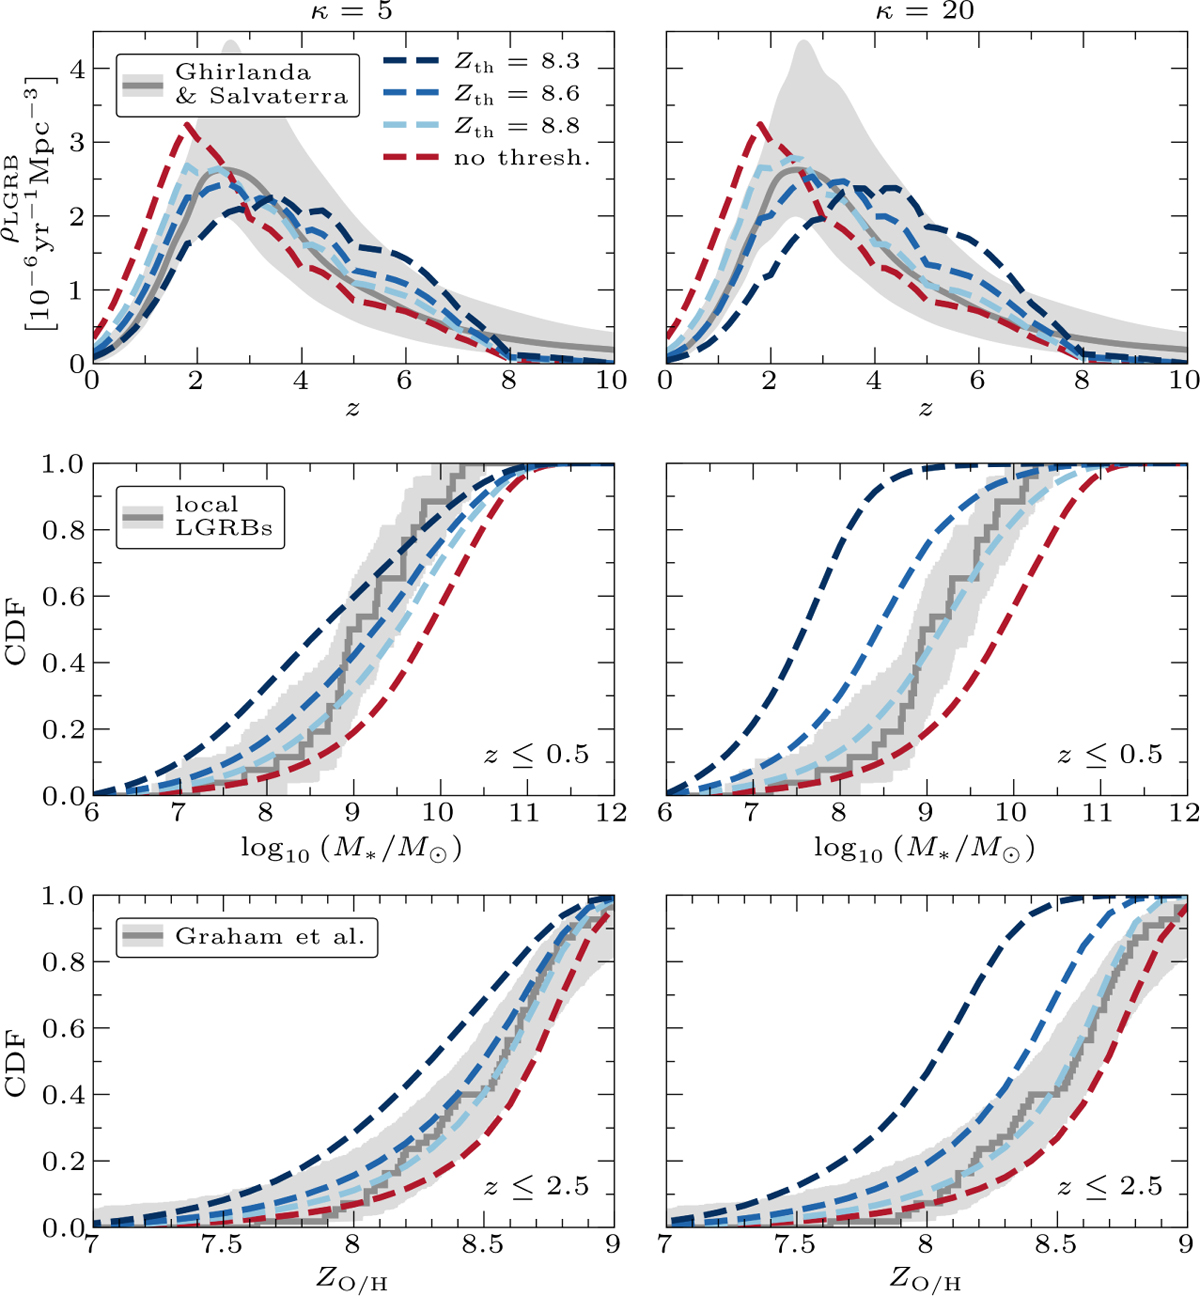
Fig. B.1
Download original image
Resulting distributions after changing our model to incorporate the MZR of Kobulnicky & Kewley (2004) instead of the MZR of Sanders et al. (2021), showing results for Zth = 8.3, 8.6, and 8.8 as well as no threshold at all (dark blue, blue, light blue, and red, respectively) and κ = 5 and 20 (left and right column, respectively). The higher value of κ corresponds to a sharper cutoff in ηLGRB (see Eq. (16) and Fig. 4). The red line with no implemented threshold traces the SFR distribution. We compare the simulation to the rate estimate of Ghirlanda & Salvaterra (2022), the host galaxy masses listed in Appendix A, and the KK04 metallicity estimates of Graham et al. (2023), see Fig. 7 for more details. The latter two distributions were bootstrapped and scattered in order to account for the limited sample size and observational uncertainty (as described in Sect. 3), where in the bottom row we use the median uncertainty (i.e. 0.21) for the data points with no listed uncertainty. The light grey areas show the 95% confidence intervals.
Current usage metrics show cumulative count of Article Views (full-text article views including HTML views, PDF and ePub downloads, according to the available data) and Abstracts Views on Vision4Press platform.
Data correspond to usage on the plateform after 2015. The current usage metrics is available 48-96 hours after online publication and is updated daily on week days.
Initial download of the metrics may take a while.