Fig. C.1
Download original image
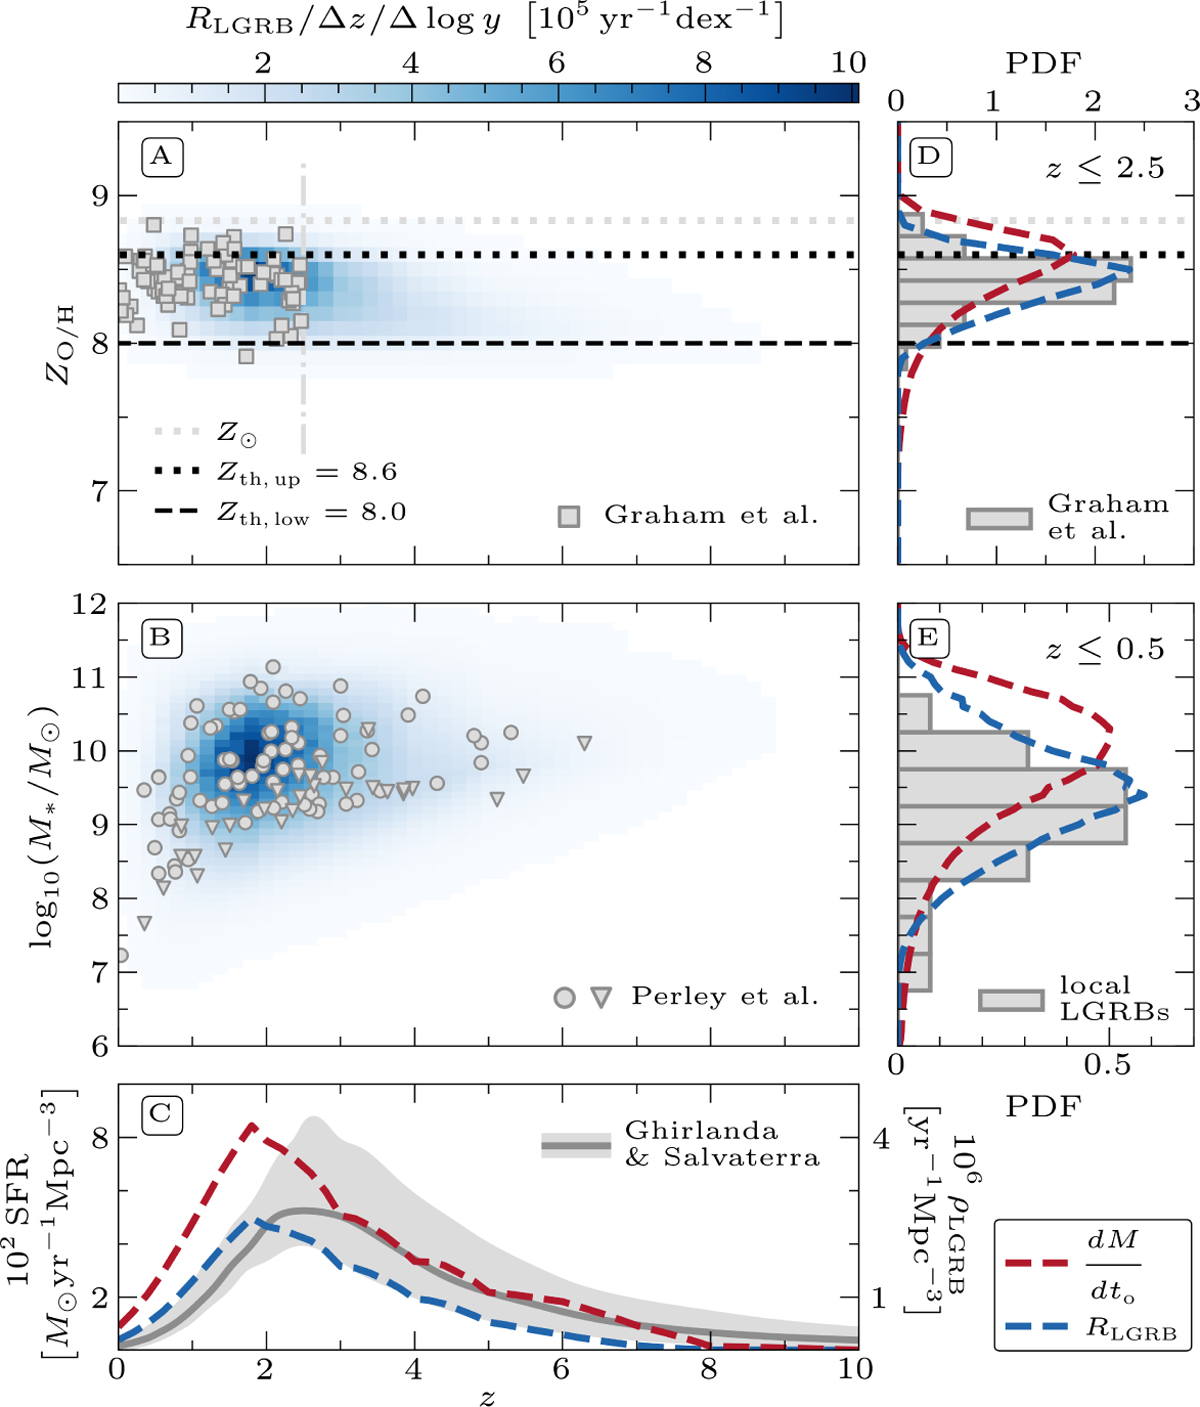
Results of our model for a LGRB efficiency, as defined in Eq. (C.1), with Zth, low = 8.0, Zth, up = 8.6, and η0 set at ![]() . The figure is similar to the right part of Fig. 6, where the blue distributions show the RLGRB model predictions and are compared to the results of Graham et al. (2023), Perley et al. (2016c), and Ghirlanda & Salvaterra (2022). The integrated metallicity (for z ≤ 2.5) and host galaxy mass (for z ≤ 0.5) distributions are compared respectively to the results of Graham et al. (2023, through the method of Curti et al. 2017, 2020) and the local LGRB sample listed in Appendix A. We note that panel C shows the SFR and LGRB rates on two different scales (cf. panels C and F from Fig. 6).
. The figure is similar to the right part of Fig. 6, where the blue distributions show the RLGRB model predictions and are compared to the results of Graham et al. (2023), Perley et al. (2016c), and Ghirlanda & Salvaterra (2022). The integrated metallicity (for z ≤ 2.5) and host galaxy mass (for z ≤ 0.5) distributions are compared respectively to the results of Graham et al. (2023, through the method of Curti et al. 2017, 2020) and the local LGRB sample listed in Appendix A. We note that panel C shows the SFR and LGRB rates on two different scales (cf. panels C and F from Fig. 6).
Current usage metrics show cumulative count of Article Views (full-text article views including HTML views, PDF and ePub downloads, according to the available data) and Abstracts Views on Vision4Press platform.
Data correspond to usage on the plateform after 2015. The current usage metrics is available 48-96 hours after online publication and is updated daily on week days.
Initial download of the metrics may take a while.