Fig. 6
Download original image
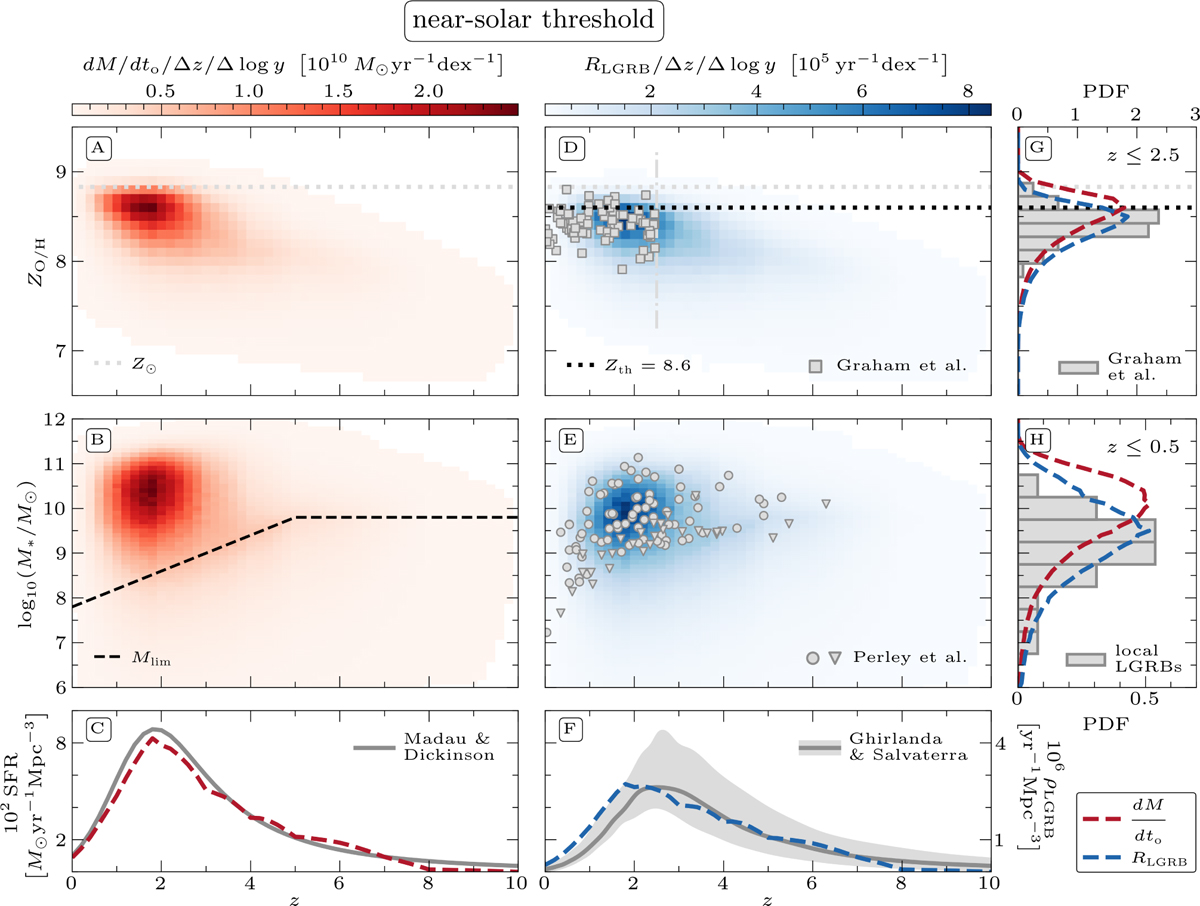
Results of our model with a near-solar threshold at Zth = 8.6 (i.e. at ~0.6 Z⊙), where κ = 20 (i.e. simulating a sharp metallicity cutoff) and the results are normalised to the LGRB rate estimate of Ghirlanda & Salvaterra (2022) so that ![]() . Panels A and B show the ZO/H,i vs zi (with bins of Δz = 0.2 and ΔZO/H = 0.1) and M*,i vs zi distributions (with bins of Δz = 0.2 and Δ log M* = 0.1 dex), respectively, corresponding to dM/dto (Eq. (17)) and divided by the bin sizes Δz = 0.2 and Δ log y = Δ log Z = Δ log M* = 0.1 to make the values independent of bin size choice. In these distributions we set all values less than 0.01% of the maximum density to zero. Panel B also contains Mlim (dashed line, Eq. (1)). Panel C shows the integrated distributions shown in panels A and B (i.e. integrated over ZO/H and M*, respectively), but without the dts/dto · dV factors in Eq. (17) in order to make a comparison with the CSFH of Madau & Dickinson (2014), corrected to a Kroupa (2001) IMF (following Appendix B of Chruślińska & Nelemans 2019). Panels D and E show distributions similar to panels A and B, but instead weighted by RLGRB/Δz/Δ log y. For a comparison with observation, we show the C17 metallicity estimates of Graham et al. (2023) and the mass estimates of Perley et al. (2016c) in the respective panels, where the former is valid for z ≤ 2.5 (shown with a dash-dotted grey line) and the latter contains constrained estimates (circles) as well as upper limits (triangles). Panel F, in turn, shows the integrated RLGRB distribution, similarly to panel C without the dts/dto · dV factors, effectively resulting in a LGRB density (ρLGRB), together with the results of Ghirlanda & Salvaterra (2022, dark grey line) and its 1σ uncertainty (shaded region). Panel G shows a normalised histogram (with bins of 0.15) corresponding to the Graham et al. (2023) metallicities, which are valid for z ≤ 2.5, and the distributions from panels A and D, integrated over redshift within this redshift region and normalised (red and blue lines, respectively). In panels D and G we also show Zth (dotted line). Finally, panel H shows a normalised histogram (with bins of 0.5 dex) of the host stellar masses in our local LGRBs sample (Appendix A, different from the data shown in panel E), valid for z ≤ 0.5, together with the corresponding distributions from panels B and E that were integrated over redshift for z ≤ 0.5 and normalised (red and blue lines, respectively). The dotted grey line in the top row shows solar metallicity.
. Panels A and B show the ZO/H,i vs zi (with bins of Δz = 0.2 and ΔZO/H = 0.1) and M*,i vs zi distributions (with bins of Δz = 0.2 and Δ log M* = 0.1 dex), respectively, corresponding to dM/dto (Eq. (17)) and divided by the bin sizes Δz = 0.2 and Δ log y = Δ log Z = Δ log M* = 0.1 to make the values independent of bin size choice. In these distributions we set all values less than 0.01% of the maximum density to zero. Panel B also contains Mlim (dashed line, Eq. (1)). Panel C shows the integrated distributions shown in panels A and B (i.e. integrated over ZO/H and M*, respectively), but without the dts/dto · dV factors in Eq. (17) in order to make a comparison with the CSFH of Madau & Dickinson (2014), corrected to a Kroupa (2001) IMF (following Appendix B of Chruślińska & Nelemans 2019). Panels D and E show distributions similar to panels A and B, but instead weighted by RLGRB/Δz/Δ log y. For a comparison with observation, we show the C17 metallicity estimates of Graham et al. (2023) and the mass estimates of Perley et al. (2016c) in the respective panels, where the former is valid for z ≤ 2.5 (shown with a dash-dotted grey line) and the latter contains constrained estimates (circles) as well as upper limits (triangles). Panel F, in turn, shows the integrated RLGRB distribution, similarly to panel C without the dts/dto · dV factors, effectively resulting in a LGRB density (ρLGRB), together with the results of Ghirlanda & Salvaterra (2022, dark grey line) and its 1σ uncertainty (shaded region). Panel G shows a normalised histogram (with bins of 0.15) corresponding to the Graham et al. (2023) metallicities, which are valid for z ≤ 2.5, and the distributions from panels A and D, integrated over redshift within this redshift region and normalised (red and blue lines, respectively). In panels D and G we also show Zth (dotted line). Finally, panel H shows a normalised histogram (with bins of 0.5 dex) of the host stellar masses in our local LGRBs sample (Appendix A, different from the data shown in panel E), valid for z ≤ 0.5, together with the corresponding distributions from panels B and E that were integrated over redshift for z ≤ 0.5 and normalised (red and blue lines, respectively). The dotted grey line in the top row shows solar metallicity.
Current usage metrics show cumulative count of Article Views (full-text article views including HTML views, PDF and ePub downloads, according to the available data) and Abstracts Views on Vision4Press platform.
Data correspond to usage on the plateform after 2015. The current usage metrics is available 48-96 hours after online publication and is updated daily on week days.
Initial download of the metrics may take a while.