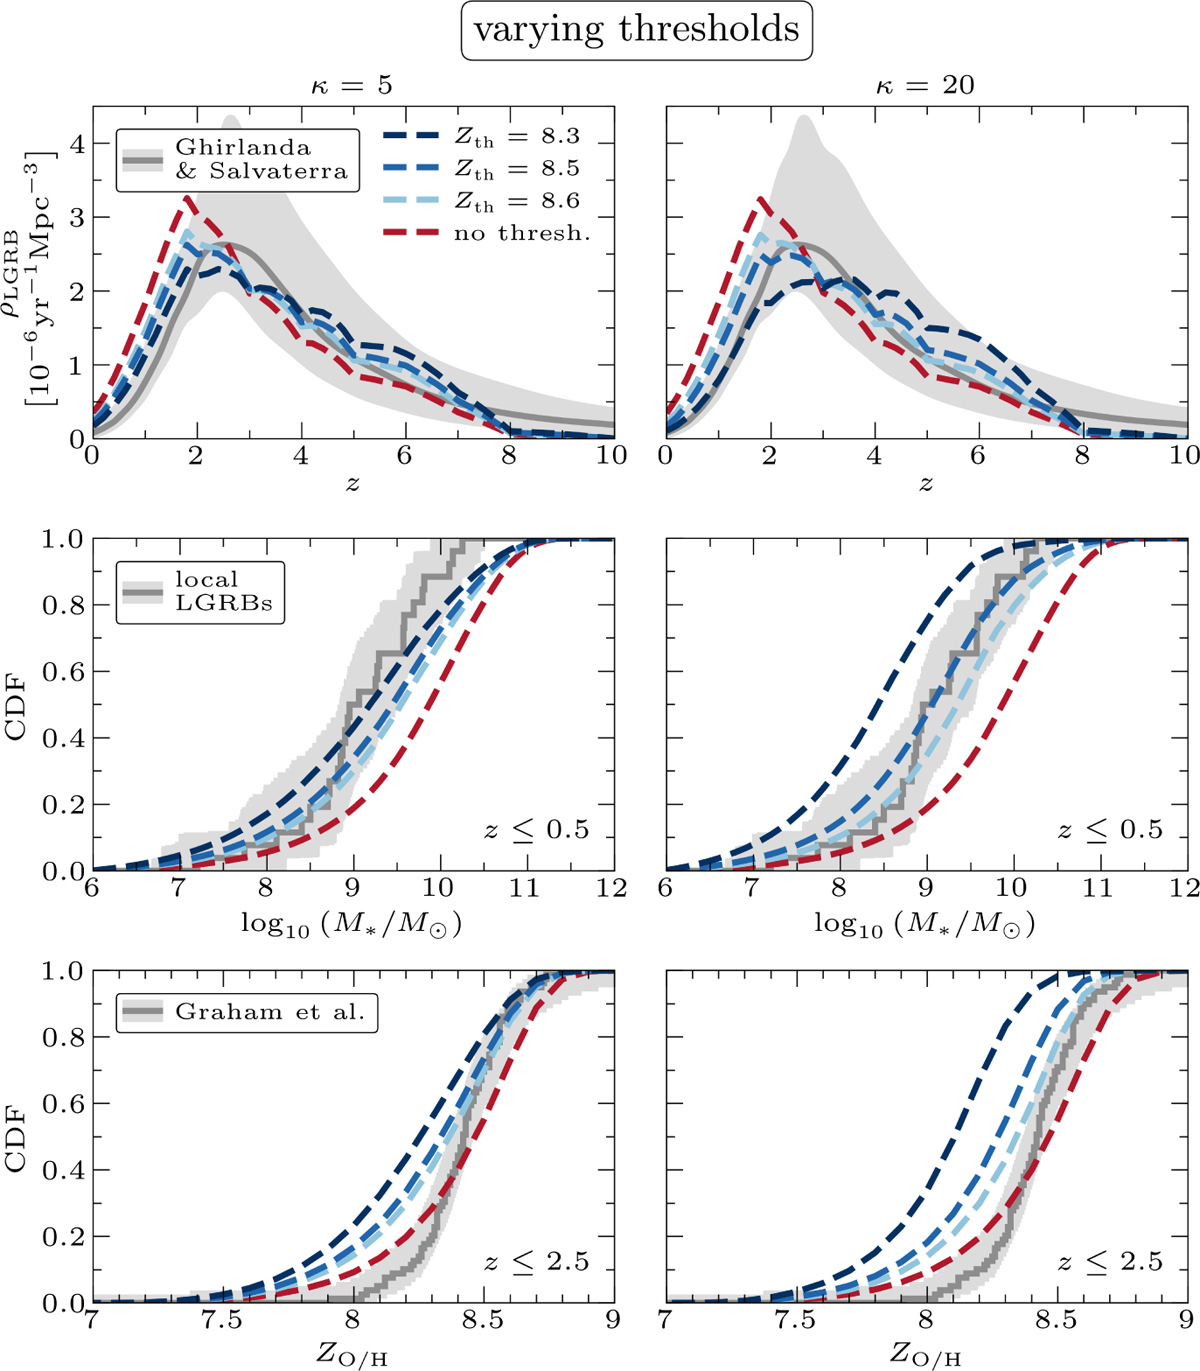
Fig. 7
Download original image
Resulting distributions for Zth = 8.3, 8.5, and 8.6 as well as no threshold at all (dark blue, blue, light blue, and red, respectively) and κ = 5 and 20 (left and right column, respectively). The higher value of κ corresponds to a sharper cutoff in ηLGRB (see Eq. (16) and Fig. 4), and η0 is recalculated for each distribution. The red line with no implemented threshold traces the SFR distribution. In the top row we compare the simulated LGRB rates per unit cosmic volume in the source frame of reference (ρLGRB; see also panel F in Fig. 6) with the results of Ghirlanda & Salvaterra (2022). In the middle row we show the cumulative distributions of our results for z ≤ 0.5 together with the cumulative distribution of the local LGRB host masses as listed in Appendix A (dark grey CDF, with bins of 0.001). The bottom row shows the cumulative metallicity distributions for z ≤ 2.5 compared to the C17 results of Graham et al. (2023, dark grey CDF, with bins of 0.001). In Appendix B we employ the Kobulnicky & Kewley (2004) MZR to provide a comparison for the KK04 metallicity estimates of Graham et al. (2023). The distributions of the local LGRB host masses and the C17 metallicity estimates were bootstrapped and scattered in order to account for limited sample size and observational uncertainty (as described in Sect. 3), the light grey areas show the 95% confidence intervals. We note that the sampling uncertainty on our model distributions is negligible relative to these confidence intervals.
Current usage metrics show cumulative count of Article Views (full-text article views including HTML views, PDF and ePub downloads, according to the available data) and Abstracts Views on Vision4Press platform.
Data correspond to usage on the plateform after 2015. The current usage metrics is available 48-96 hours after online publication and is updated daily on week days.
Initial download of the metrics may take a while.