Open Access
Fig. 1
Download original image
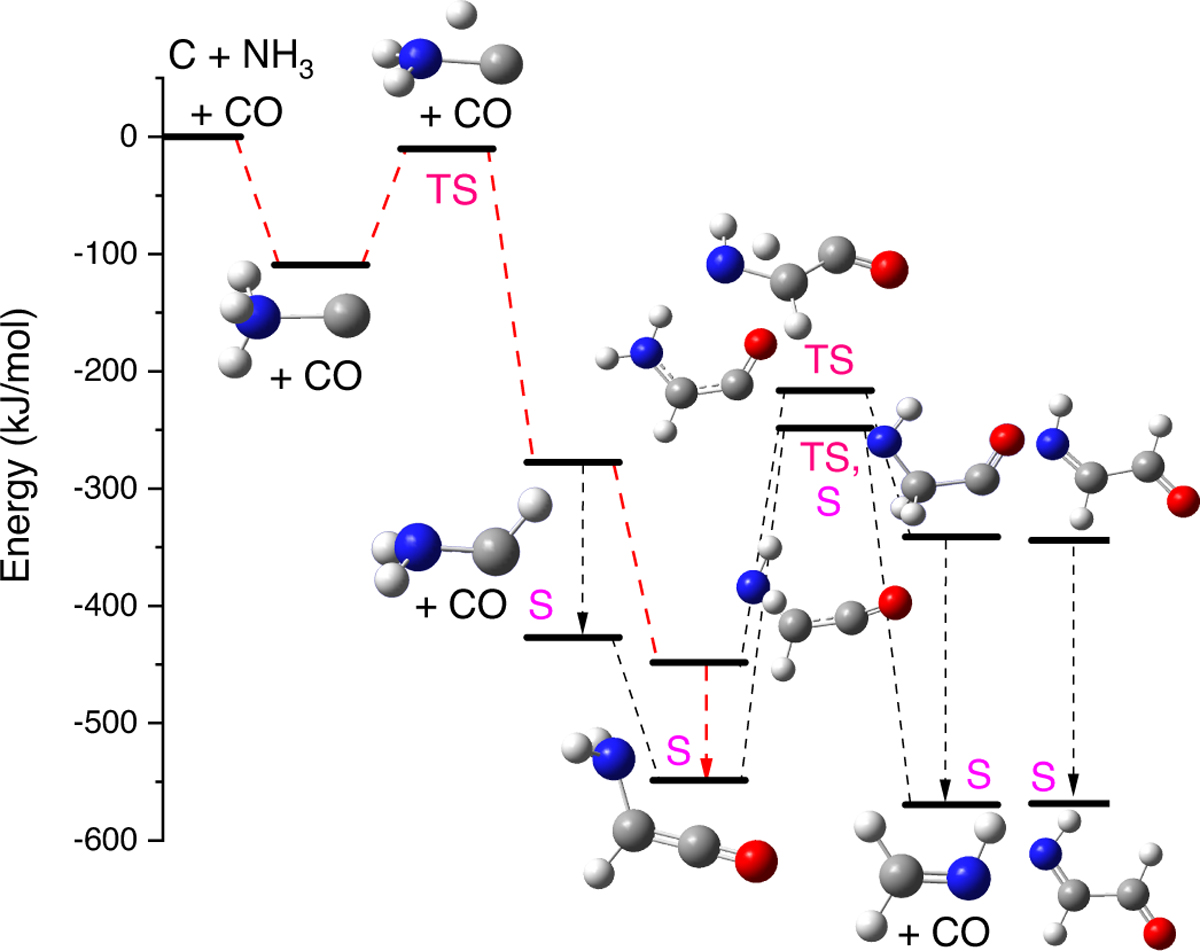
Energy level diagram of the C+NH3+CO reaction. The reaction proceeds from left to right. It starts with a triplet state; the intersystem crossings to the singlet states are marked with dashed arrows. S and TS stand for singlet and transition states. Red lines indicate the most probably pathway.
Current usage metrics show cumulative count of Article Views (full-text article views including HTML views, PDF and ePub downloads, according to the available data) and Abstracts Views on Vision4Press platform.
Data correspond to usage on the plateform after 2015. The current usage metrics is available 48-96 hours after online publication and is updated daily on week days.
Initial download of the metrics may take a while.