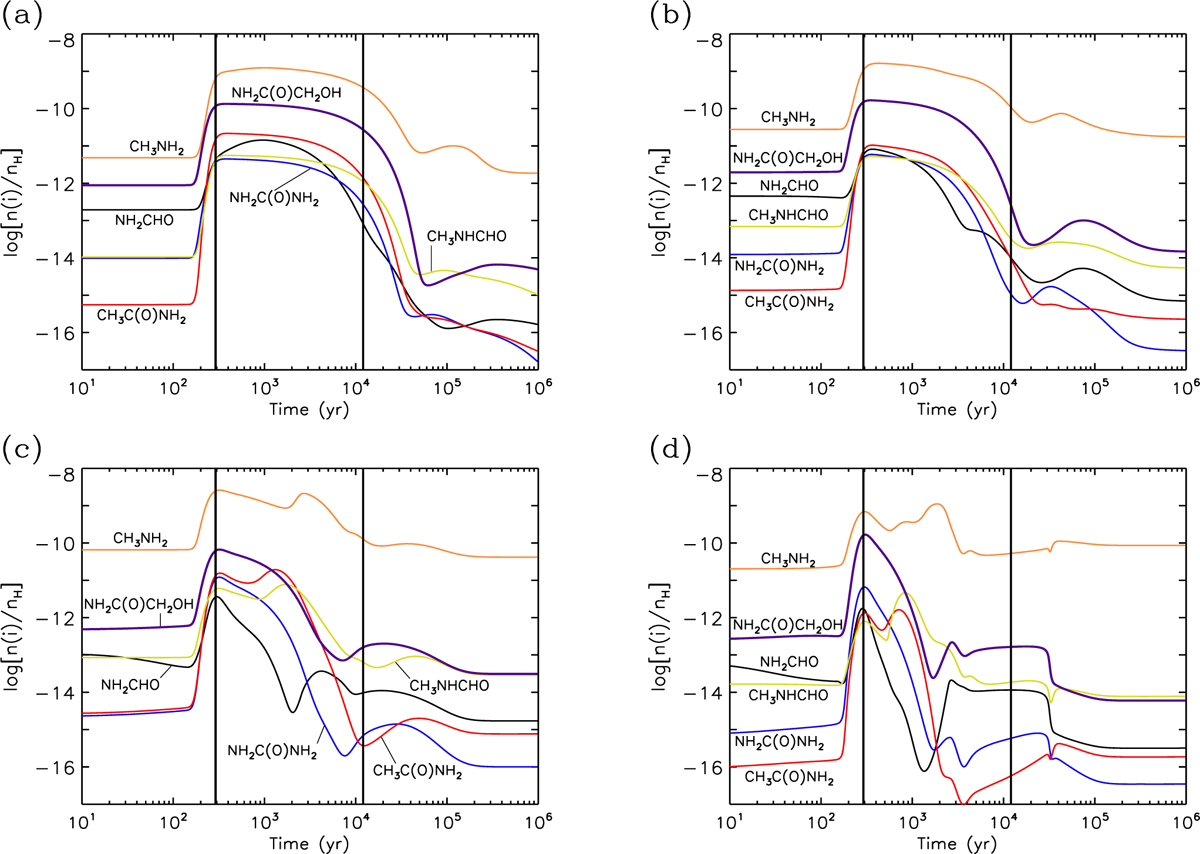
Fig. 7
Download original image
Fractional gas-phase abundances with respect to total hydrogen of nitrogen-bearing species observed in G+0.693. The first vertical line indicates the approximate time for the peak abundances of the species. The second vertical line indicates the time when the gas temperature has returned to the starting temperature of 100 K. The four panels represent the four setups with increasing CRIR (a) S-LCR, S-MCR, S-HCR, and S-VHCR.
Current usage metrics show cumulative count of Article Views (full-text article views including HTML views, PDF and ePub downloads, according to the available data) and Abstracts Views on Vision4Press platform.
Data correspond to usage on the plateform after 2015. The current usage metrics is available 48-96 hours after online publication and is updated daily on week days.
Initial download of the metrics may take a while.