Fig. 8
Download original image
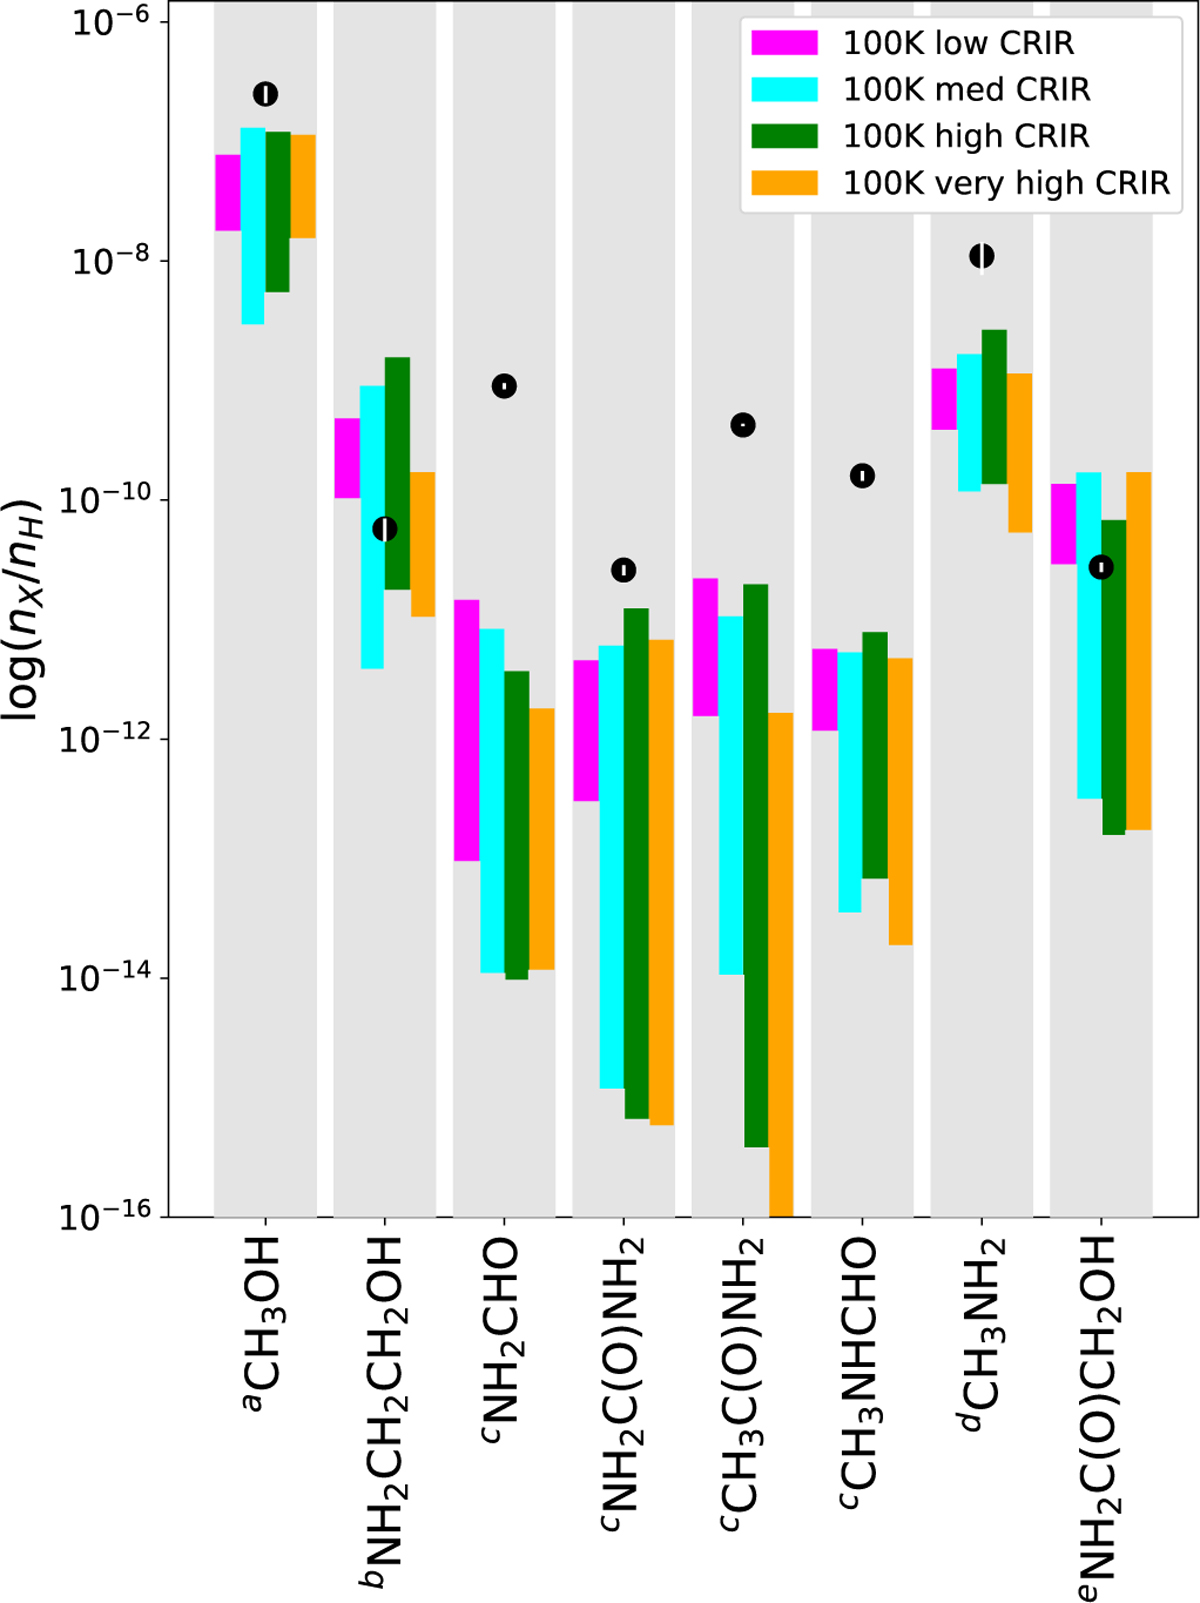
Comparison of observed fractional abundances with respect to H2 of a selection of COMs that have been observed in G+0.693 to their predicted gas-phase abundances for the S-LCR, S-MCR, S-HCR, and S-VHCR setups used in this work. Observational values correspond to column density ratios. The maximum values included correspond to the peak abundance in the shocked stage. The minimum values included correspond to when the gas temperature has cooled to 100 K, an estimate of the gas kinetic temperature according to Zeng et al. (2018). The observation values are represented as black dots, with errors included as white vertical lines. The values are taken from multiple sources (a) Requena-Torres et al. (2008), (b) Rivilla et al. (2021), (c) Zeng et al. (2023), (d) Zeng et al. (2018), and (e) Rivilla et al. (2023).
Current usage metrics show cumulative count of Article Views (full-text article views including HTML views, PDF and ePub downloads, according to the available data) and Abstracts Views on Vision4Press platform.
Data correspond to usage on the plateform after 2015. The current usage metrics is available 48-96 hours after online publication and is updated daily on week days.
Initial download of the metrics may take a while.