Fig. 1.
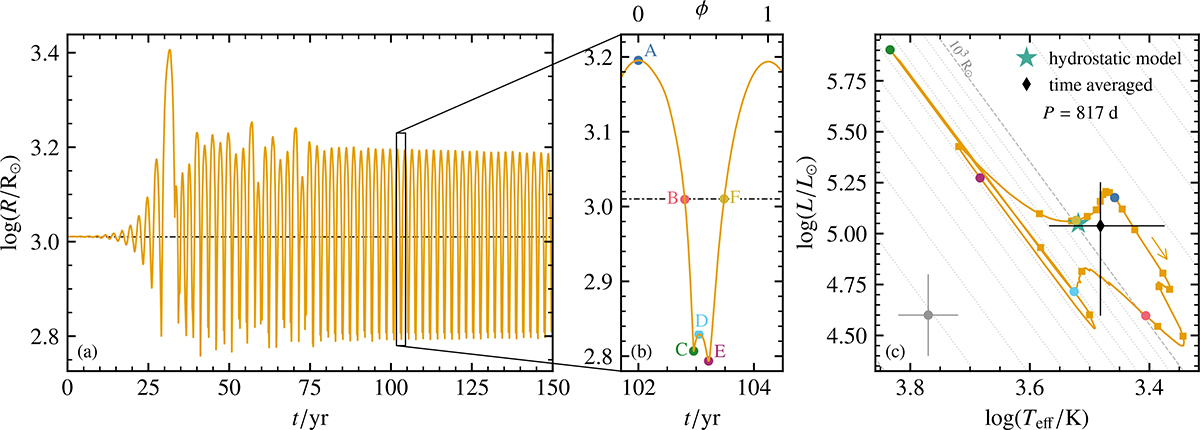
Download original image
Radial pulsation of the RSG. The radius evolution is shown in panel a with a zoom-in on one pulsation cycle in panel b. The dash-dotted black line indicates the radius of the hydrostatic model. Panel c shows one pulsation cycle in the HRD. The arrow indicates the direction of the loop in the HRD, and the markers are spaced equally in time every 1/20 of the pulsation period. The hydrostatic model, the time-averaged effective temperature and luminosity, and their uncertainties are shown as well. For comparison, we show the typical uncertainty of the luminosity and effective temperature of Type II SN progenitors from Smartt (2015) as a gray marker. The colored markers labeled A–F in panels b and c indicate characteristic stages during the pulsation at which we calculate SN light curves. The pulsation phase, ϕ, is defined to be zero at maximum expansion.
Current usage metrics show cumulative count of Article Views (full-text article views including HTML views, PDF and ePub downloads, according to the available data) and Abstracts Views on Vision4Press platform.
Data correspond to usage on the plateform after 2015. The current usage metrics is available 48-96 hours after online publication and is updated daily on week days.
Initial download of the metrics may take a while.