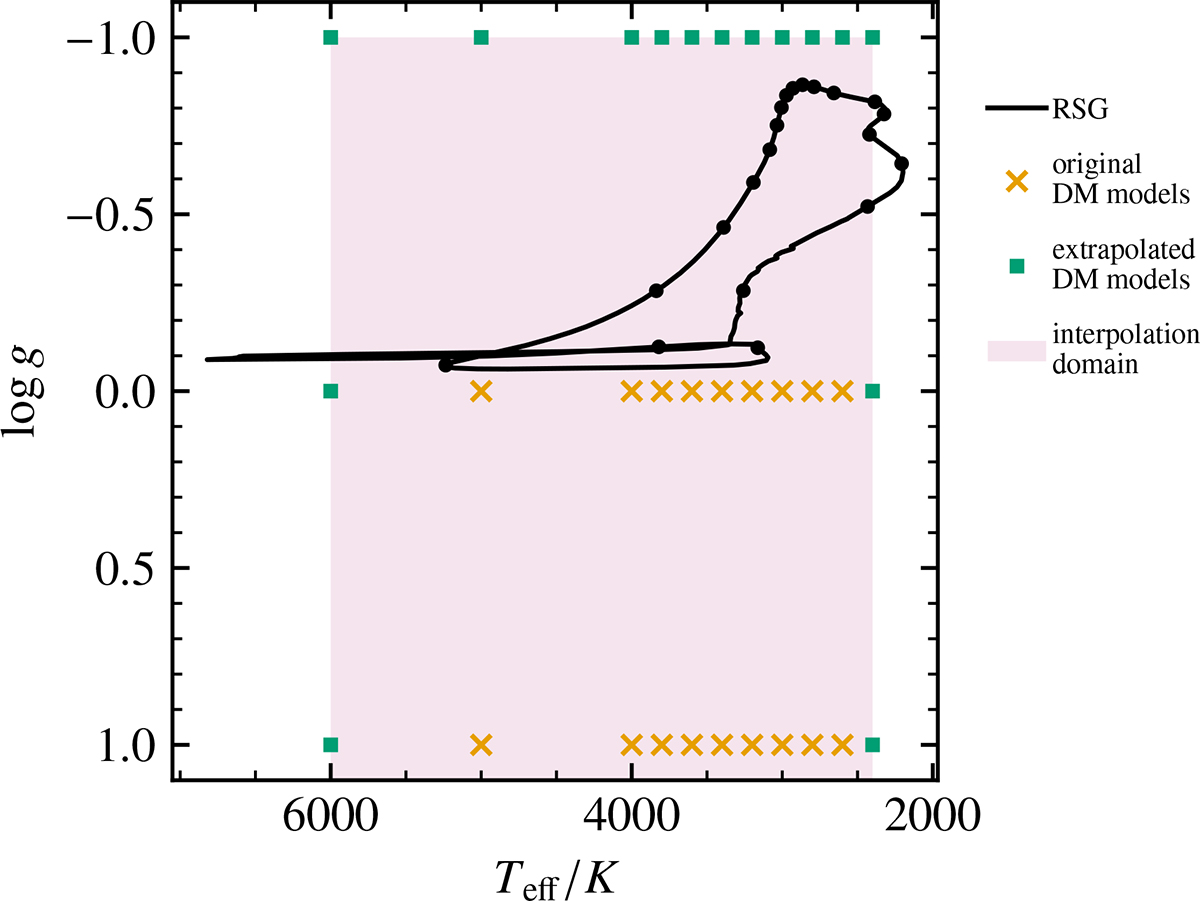
Fig. D.1.
Download original image
Kiel diagram showing the RSG pulsation cycle and the MARCS model coverage. Dots along the RSG track are spaced equally in time every 1/20 of the pulsation period. The crosses show the combinations of Teff and log g for which there are MARCS models available and for which we can compute DUSTY+MARCS (DM) models. After extending the grid by one grid spacing in each direction (green squares), we can cover 80% of the RSG pulsation cycle by linearly interpolating the newly obtained grid of DM models (shaded region).
Current usage metrics show cumulative count of Article Views (full-text article views including HTML views, PDF and ePub downloads, according to the available data) and Abstracts Views on Vision4Press platform.
Data correspond to usage on the plateform after 2015. The current usage metrics is available 48-96 hours after online publication and is updated daily on week days.
Initial download of the metrics may take a while.