Fig. E.1.
Download original image
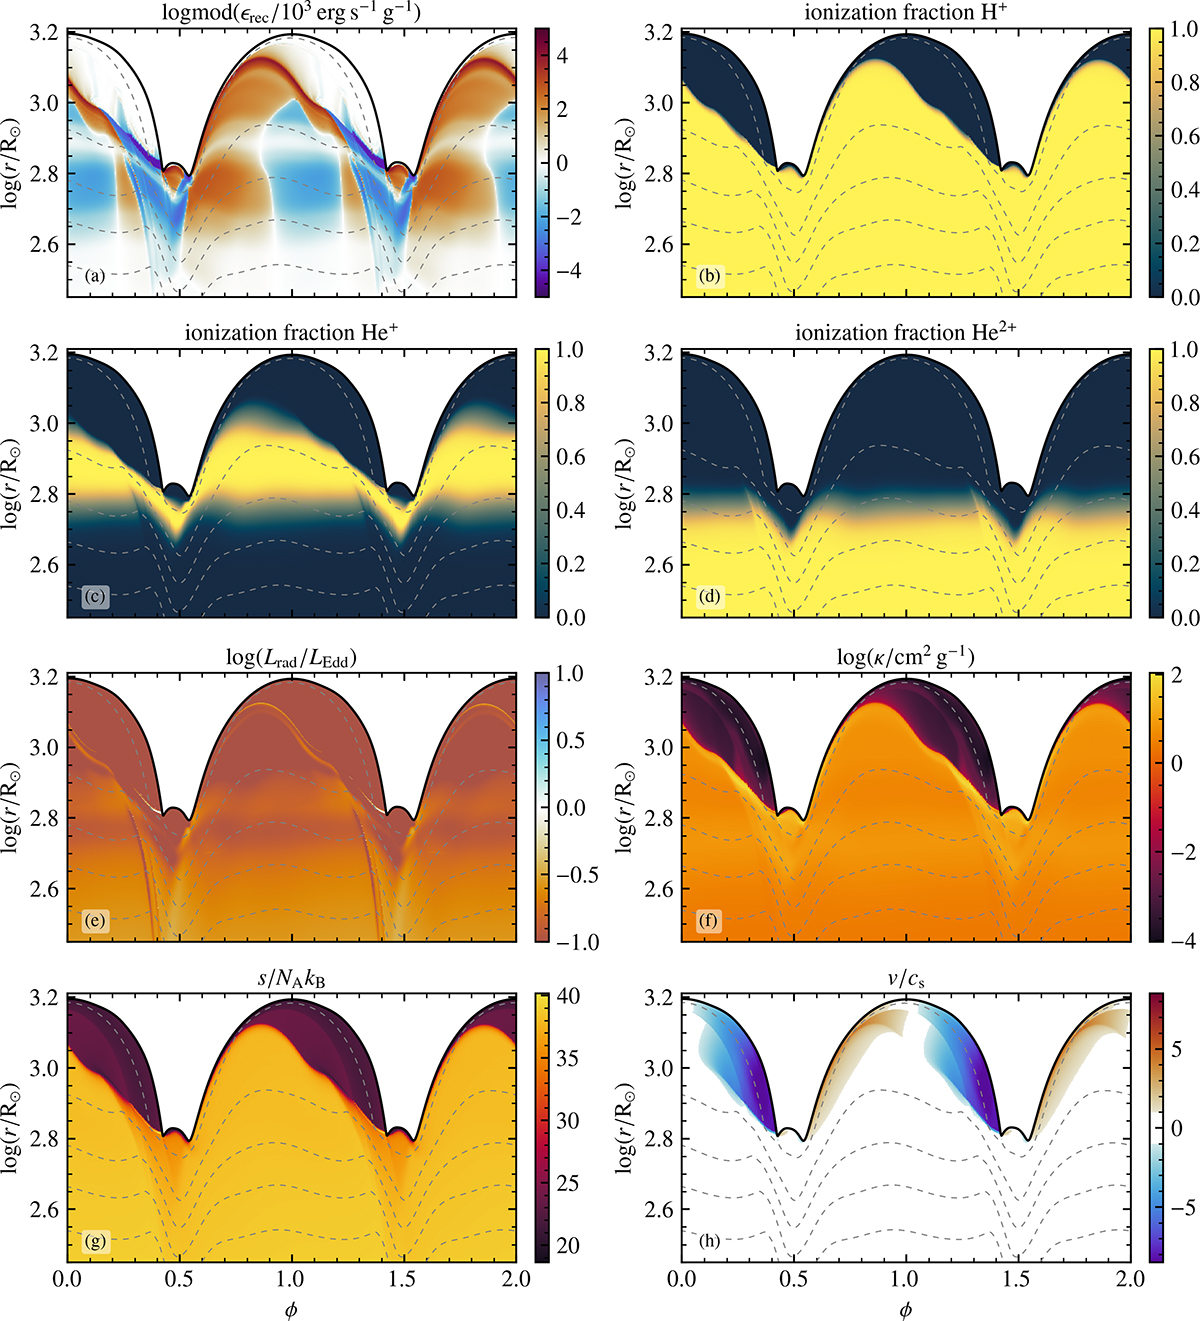
Structure evolution diagrams of the envelope of 2 full pulsation cycles. Colors show the specific released recombination energy ϵrec in panel (a), the ionization fractions of hydrogen and helium in panels (b)-(d), the radiative luminosity Lrad in units of the Eddington luminosity LEdd in panel (e), the opacity κ in panel (f), the specific entropy s in units of Avogadro’s number NA and the Boltzmann constant kB in panel (g), and the radial velocity v in units of the sound speed cs in panel (h). The dashed lines represent lines of constant mass for masses of 12, 11, 10, 9, and 8 M⊙ from top to bottom. For better visualization, the logmod transformation is used for the specific recombination energy, with logmod(x) = sign(x)log10(|x|+1) (John & Draper 1980).
Current usage metrics show cumulative count of Article Views (full-text article views including HTML views, PDF and ePub downloads, according to the available data) and Abstracts Views on Vision4Press platform.
Data correspond to usage on the plateform after 2015. The current usage metrics is available 48-96 hours after online publication and is updated daily on week days.
Initial download of the metrics may take a while.