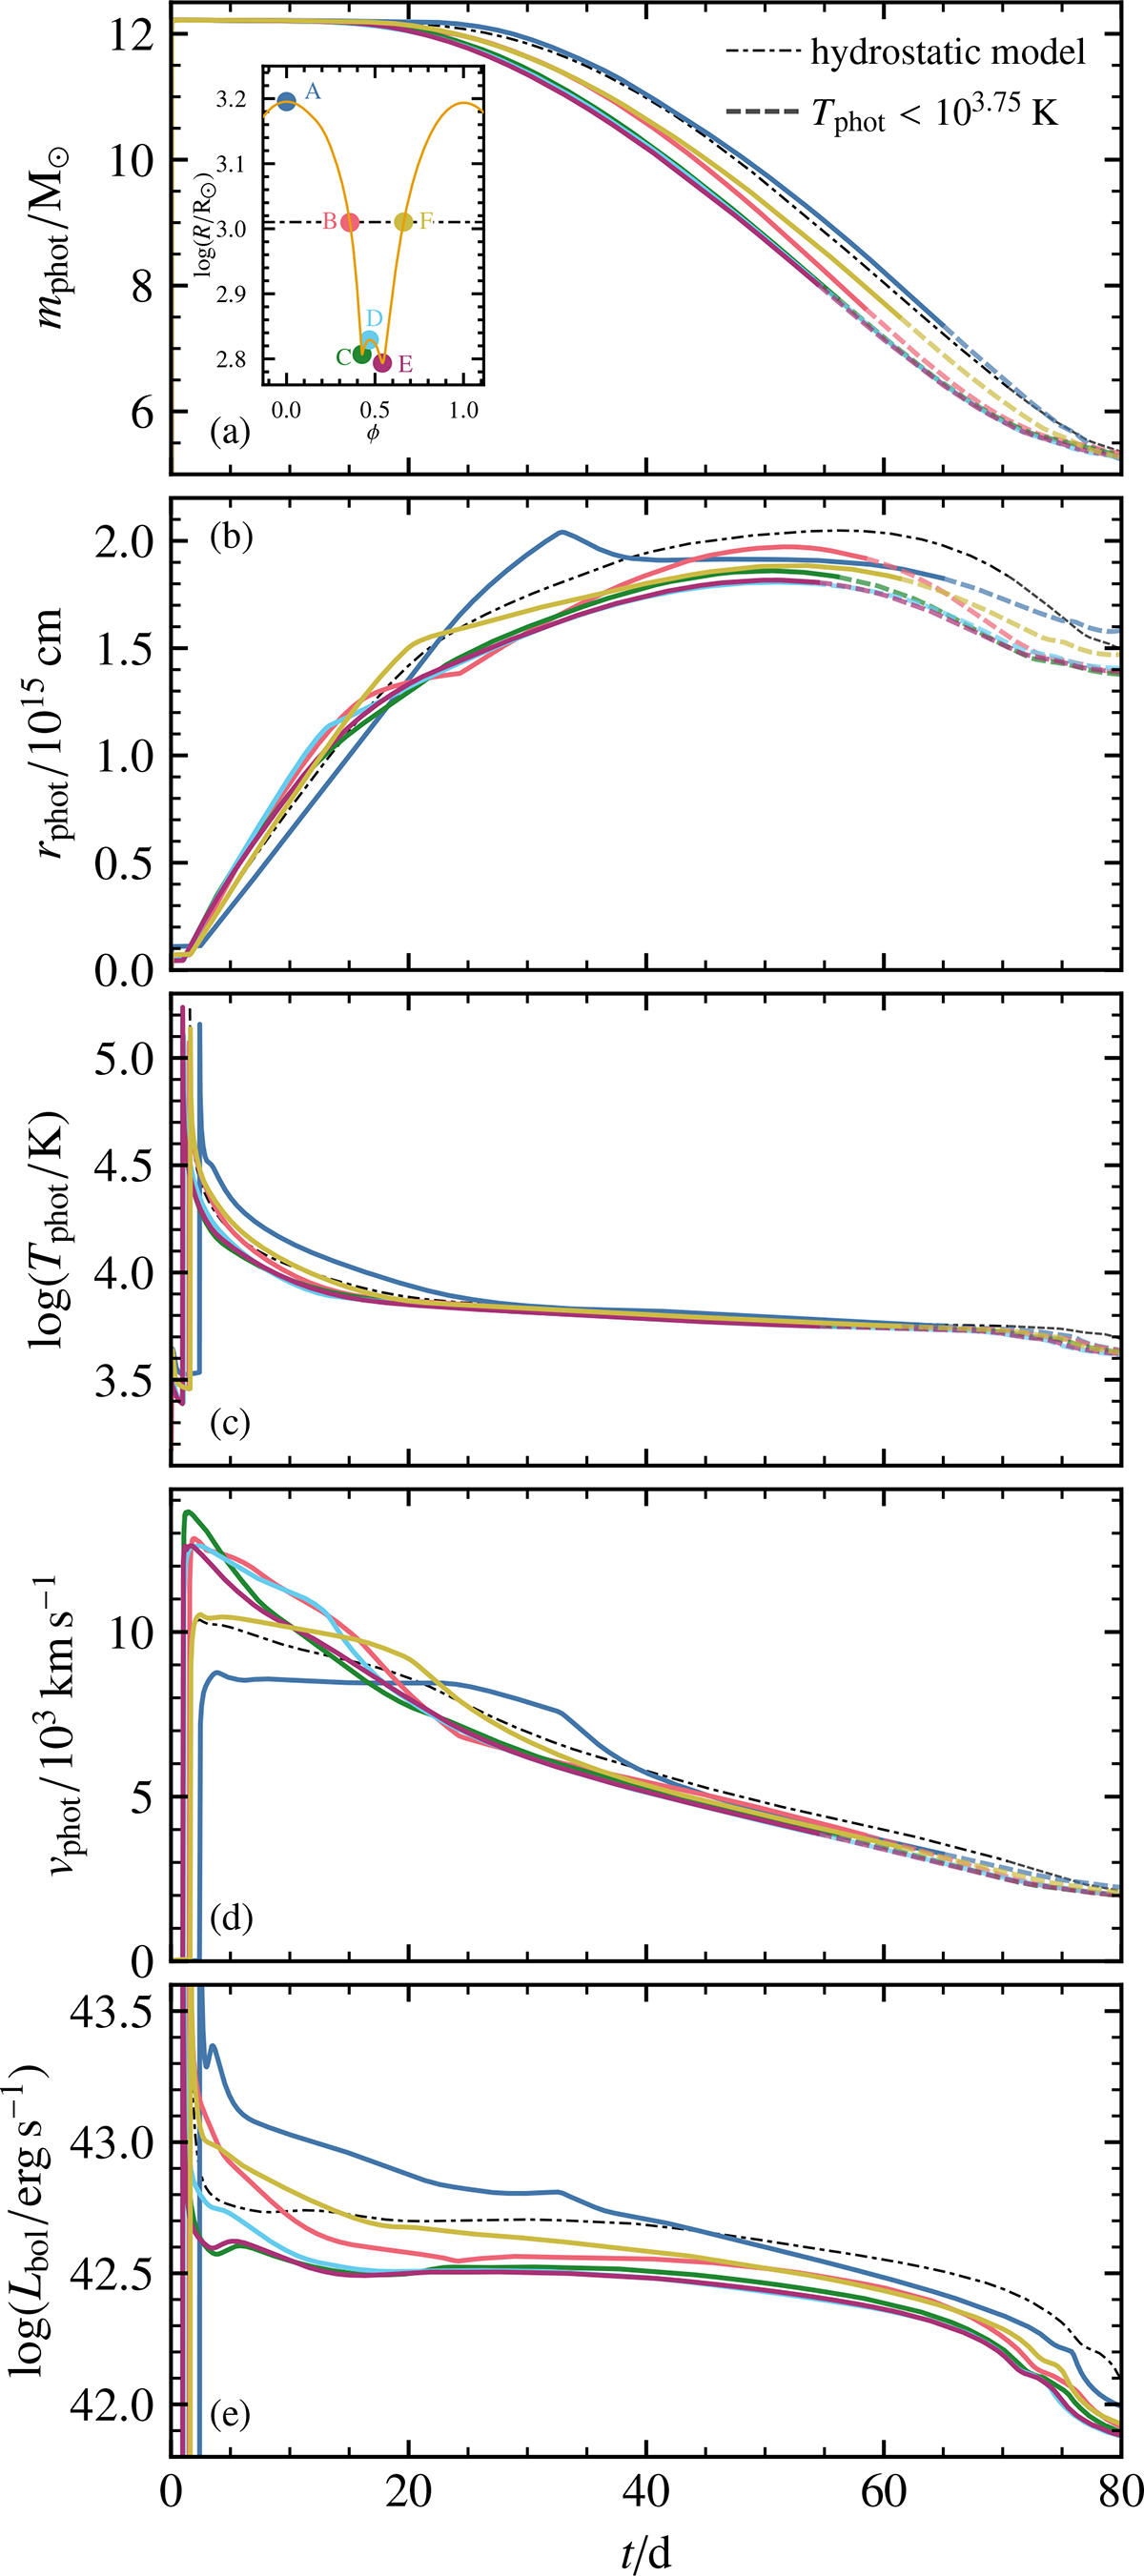
Fig. F.1.
Download original image
Time evolution of the photosphere mass coordinate (panel a), the radius of the photosphere (panel b), the effective temperature of the photosphere (panel c), and the photospheric velocity (panel d). The light dashed lines indicate the phase when the photosphere temperature drops below 103.75 K. At this point, SNEC has difficulties estimating the exact location of the photosphere (Morozova et al. 2015). The dash-dotted line illustrates the hydrostatic progenitor. The inset shows the radius evolution of one pulsation cycle and indicates the points A–F.
Current usage metrics show cumulative count of Article Views (full-text article views including HTML views, PDF and ePub downloads, according to the available data) and Abstracts Views on Vision4Press platform.
Data correspond to usage on the plateform after 2015. The current usage metrics is available 48-96 hours after online publication and is updated daily on week days.
Initial download of the metrics may take a while.