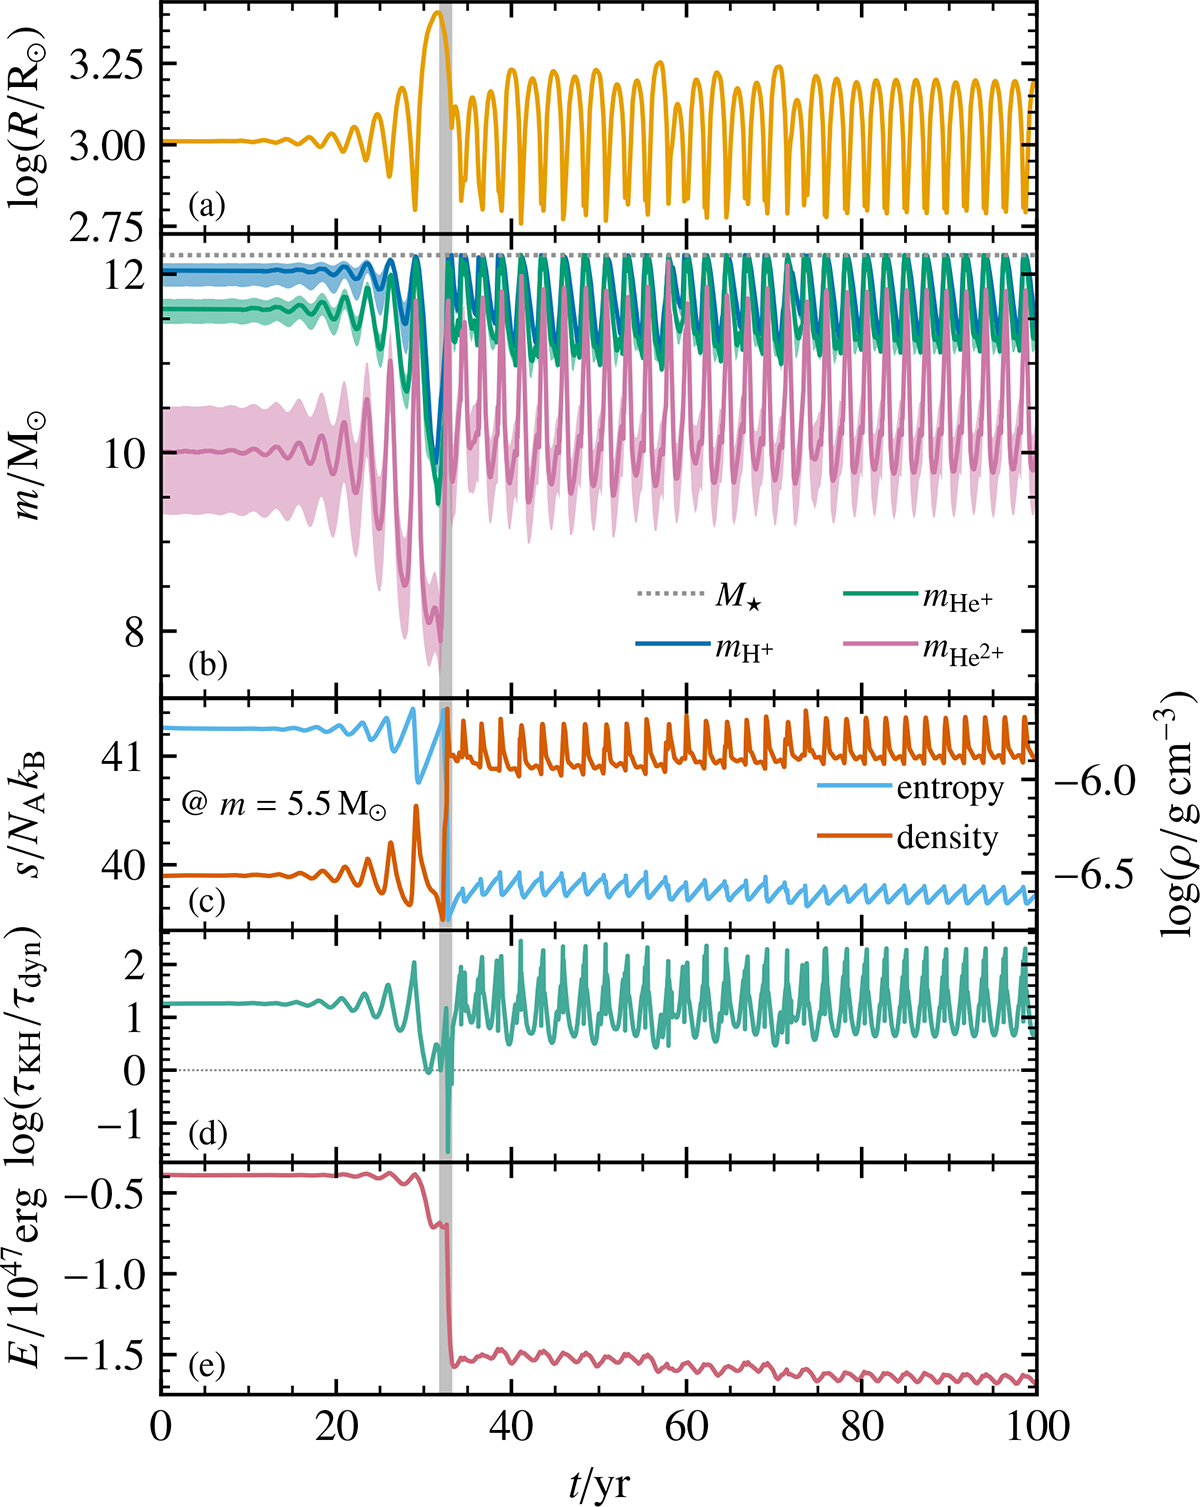
Fig. 2.
Download original image
Restructuring of the envelope during the initial transient. Panel a shows the radius of the envelope (similar to Fig. 1a). The partial ionization zones and the mass coordinates of the recombination fronts of hydrogen and helium are shown in panel b, as well as the total mass of the star. The recombination fronts are defined where the ionization fraction of the respective species reaches 0.5. The partial ionization zones are defined to be the layers where the ionization fraction of the respective species is between 10 and 90%. Panel c shows the specific entropy in units of Avogadro’s number NA and the Boltzmann constant kB, as well as the density. Both quantities are reported at a mass coordinate of 5.5 M⊙, which is close to the bottom of the convective envelope. Panel d shows the radiative cooling timescale in units of the dynamical timescale. The total energy of the convective envelope is shown in panel e. The gray band indicates the catastrophic cooling event at t ≈ 32.5 yr.
Current usage metrics show cumulative count of Article Views (full-text article views including HTML views, PDF and ePub downloads, according to the available data) and Abstracts Views on Vision4Press platform.
Data correspond to usage on the plateform after 2015. The current usage metrics is available 48-96 hours after online publication and is updated daily on week days.
Initial download of the metrics may take a while.