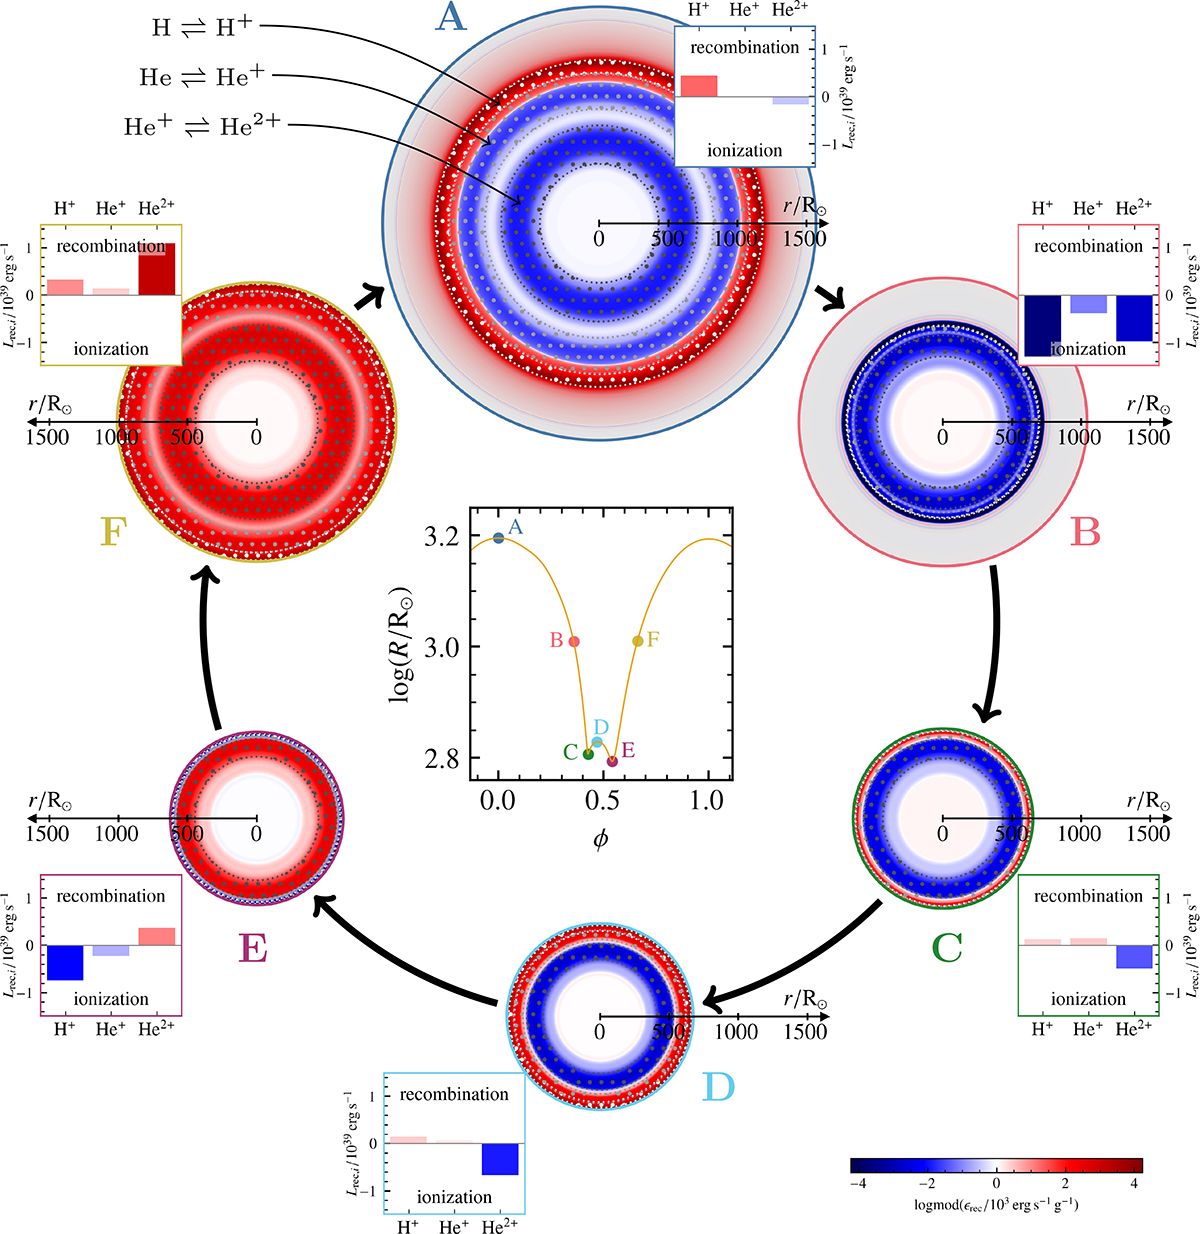
Fig. 4.
Download original image
Recombination structure of the RSG envelope at points A–F. The six colored circles show the radius of the RSG at points A–F. The coloring inside the circles shows the specific released recombination energy ϵrec as logmod(ϵrec/103 erg s−1 g−1) on a linear radial scale, with logmod(x) = sign(x)log10(|x|+1) (John & Draper 1980). Red corresponds to energy released by recombination, while blue corresponds to energy being removed via ionization. The square insets at each point show the recombination luminosity Lrec, i = ∫Menvϵrec, i dm for the species i = H+, He+ and He2+ on a linear scale. Hatched regions indicate the partial ionization zone for hydrogen and helium, defined where the ionization fraction of the corresponding species is between 1% and 99%. Light gray shading at points A and B corresponds to neutral layers (ionization fractions less than 1%). The central plot shows the radius evolution of one pulsation cycle and indicates the 6 highlighted points A–F. The temporal evolution of the recombination structure is available as an online movie.
Current usage metrics show cumulative count of Article Views (full-text article views including HTML views, PDF and ePub downloads, according to the available data) and Abstracts Views on Vision4Press platform.
Data correspond to usage on the plateform after 2015. The current usage metrics is available 48-96 hours after online publication and is updated daily on week days.
Initial download of the metrics may take a while.