Fig. 6.
Download original image
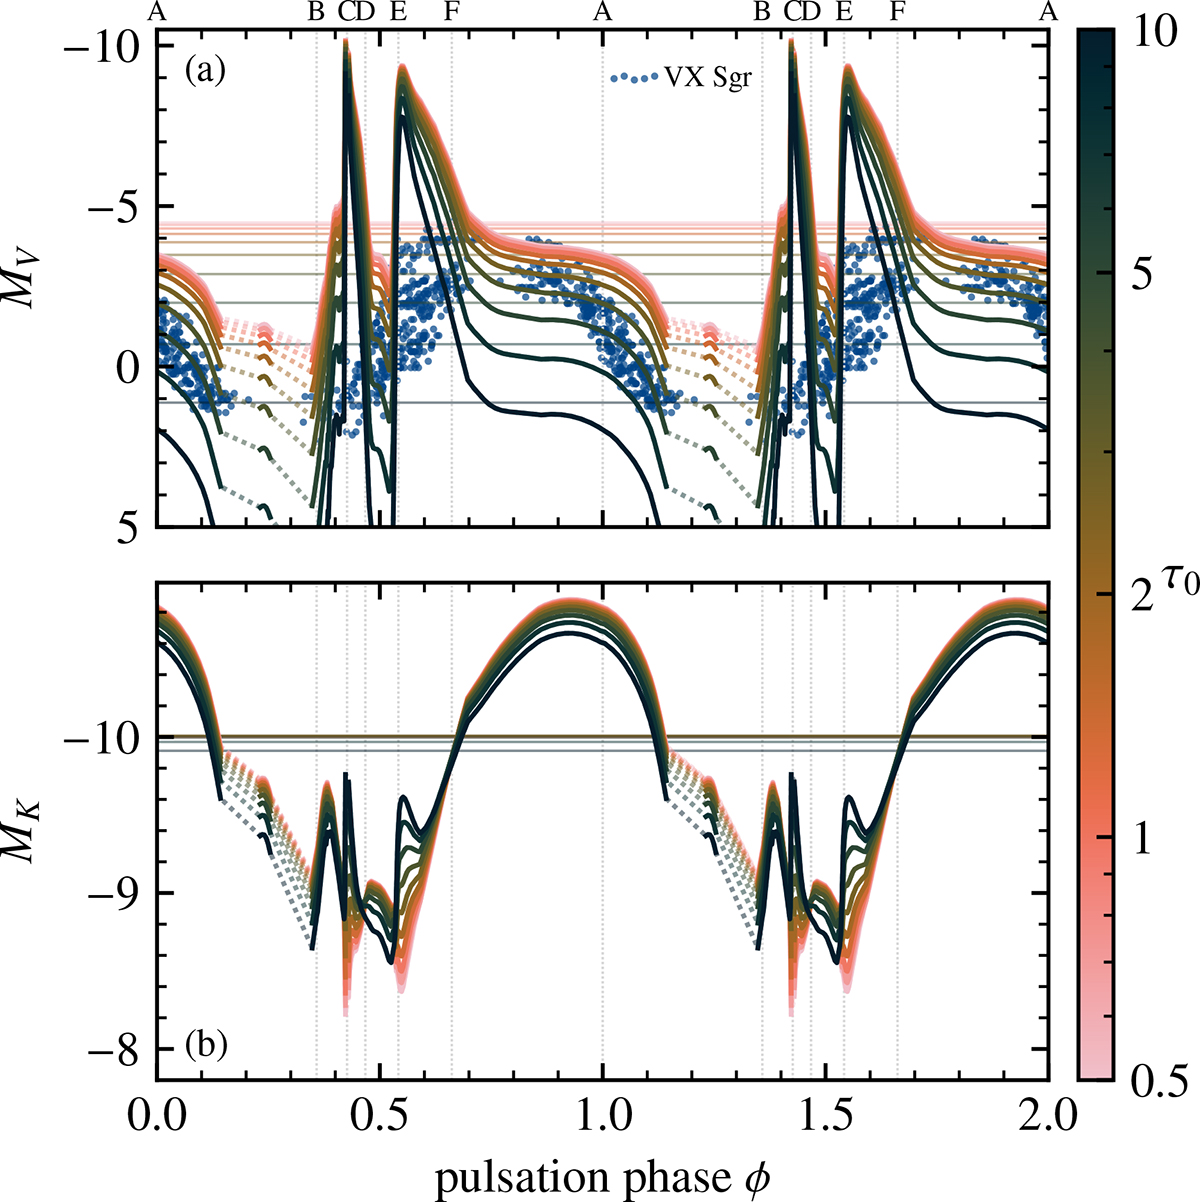
V- and K-band light curves of the pulsating RSG surrounded by a dust shell. The parameter τ0 sets the optical depth at the beginning of the pulsation cycle (ϕ = 0). The light dotted lines indicate regions outside the MARCS grid (too low Teff) that do not allow us to make photometric estimates. For better visualization, two full pulsation cycles are shown. The light, horizontal lines show the time-averaged magnitudes. For comparison, the phase-folded, visual light curve of VX Sgr is shown as well, with data taken between JD = 2640000 and 2644000, and assuming a period of 747 days.
Current usage metrics show cumulative count of Article Views (full-text article views including HTML views, PDF and ePub downloads, according to the available data) and Abstracts Views on Vision4Press platform.
Data correspond to usage on the plateform after 2015. The current usage metrics is available 48-96 hours after online publication and is updated daily on week days.
Initial download of the metrics may take a while.