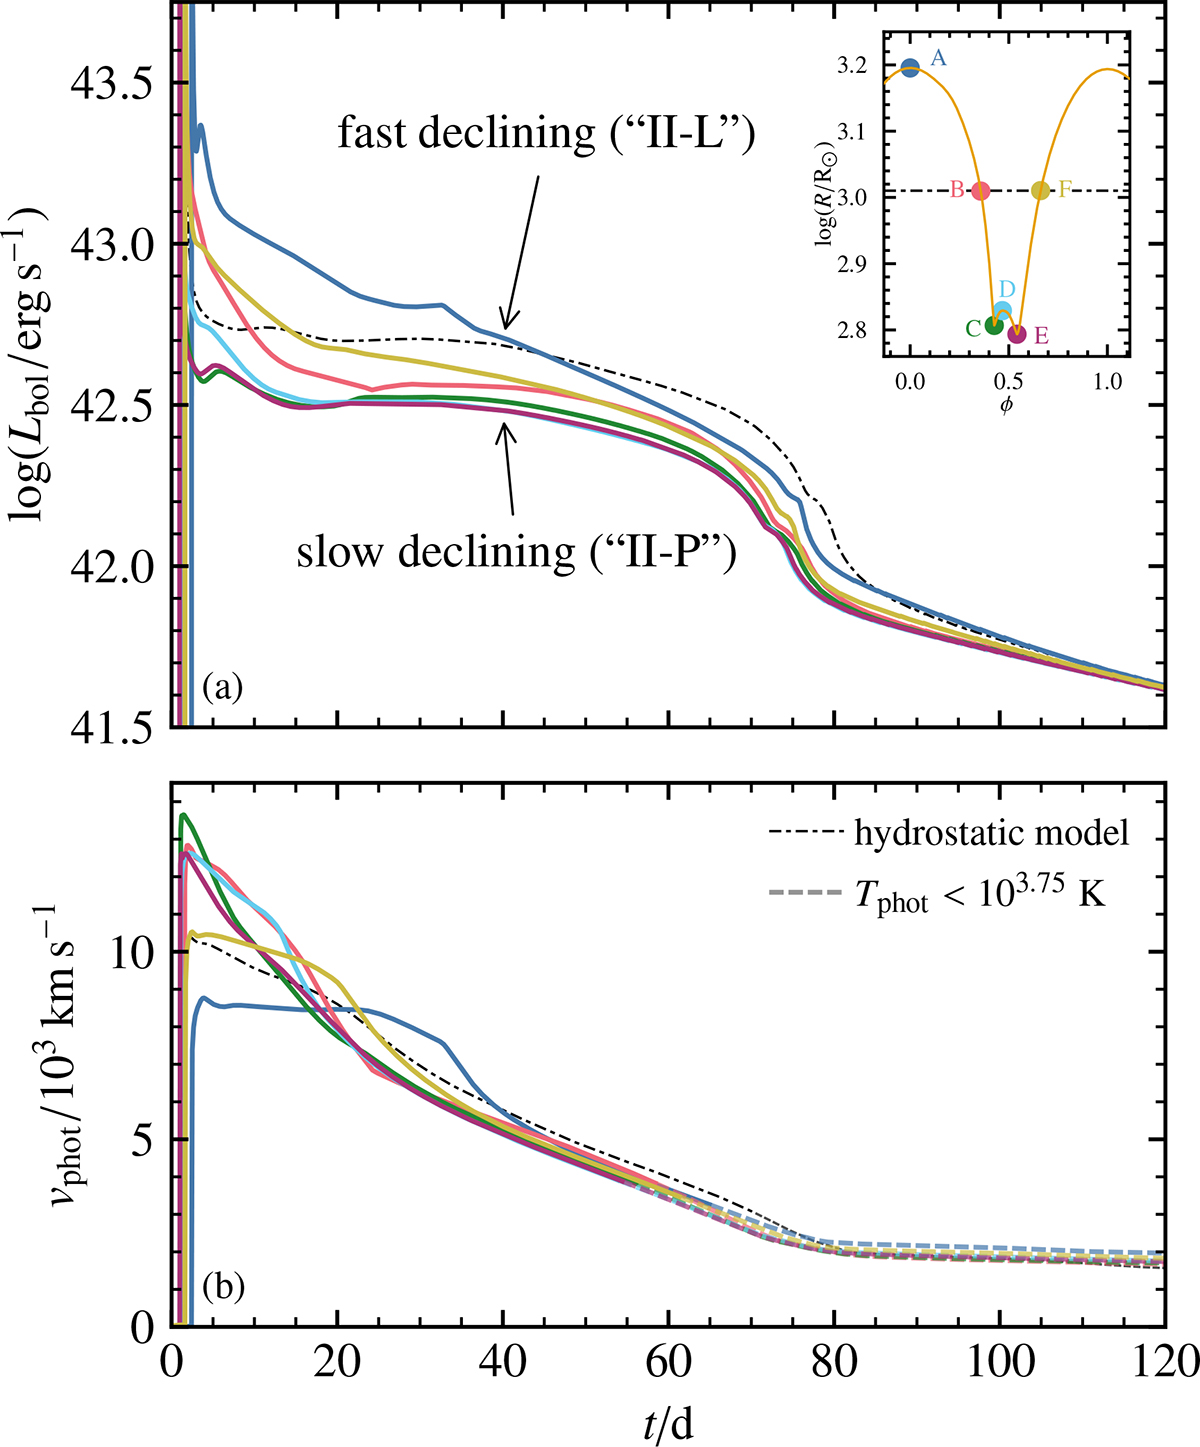
Fig. 7.
Download original image
Bolometric light curves (panel a) and photospheric velocities (panel b) for SNe at points A–F during the pulsation cycle. The explosion of the hydrostatic model is shown for comparison. The inset shows the radius evolution of one pulsation cycle and indicates the points A–F. Once the photospheric temperature drops below 103.75 K, the velocities are no longer reliable because SNEC cannot accurately estimate the location of the photosphere due to limitations in low-temperature opacities (Morozova et al. 2015). The complete ϕ-evolution of the light curve and the photometric velocity is available as an online movie.
Current usage metrics show cumulative count of Article Views (full-text article views including HTML views, PDF and ePub downloads, according to the available data) and Abstracts Views on Vision4Press platform.
Data correspond to usage on the plateform after 2015. The current usage metrics is available 48-96 hours after online publication and is updated daily on week days.
Initial download of the metrics may take a while.