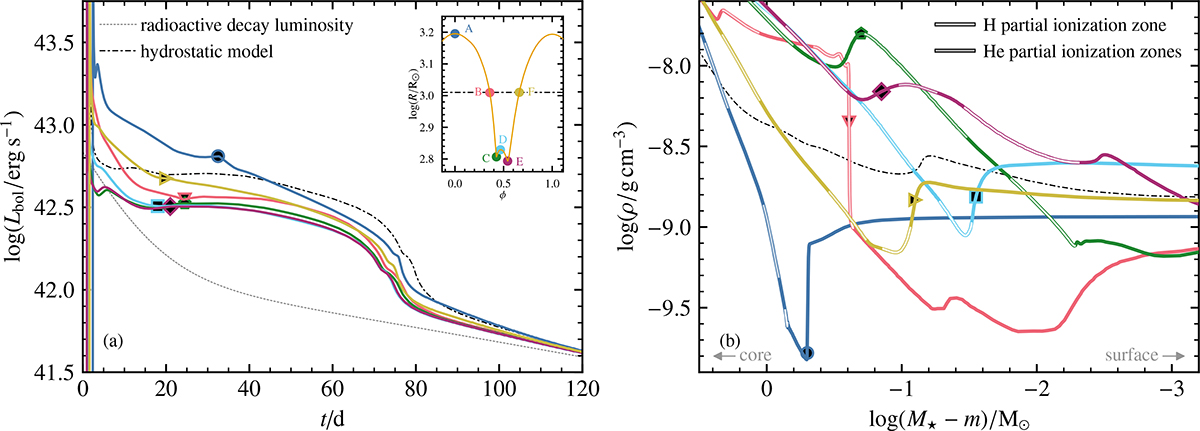
Fig. 8.
Download original image
Connecting feature in the SN light curves to features in the density profiles of the RSG envelope. Panel a is similar to Fig. 7a and panel b is similar to Fig. 5. The density profiles are shown as a function of the mass until the surface. Colored markers connect features in the density profiles to features in the SN light curves. Features in the light curve arise when the SN photosphere reaches the mass coordinates highlighted in the density profile.
Current usage metrics show cumulative count of Article Views (full-text article views including HTML views, PDF and ePub downloads, according to the available data) and Abstracts Views on Vision4Press platform.
Data correspond to usage on the plateform after 2015. The current usage metrics is available 48-96 hours after online publication and is updated daily on week days.
Initial download of the metrics may take a while.