Open Access
Fig. 10.
Download original image
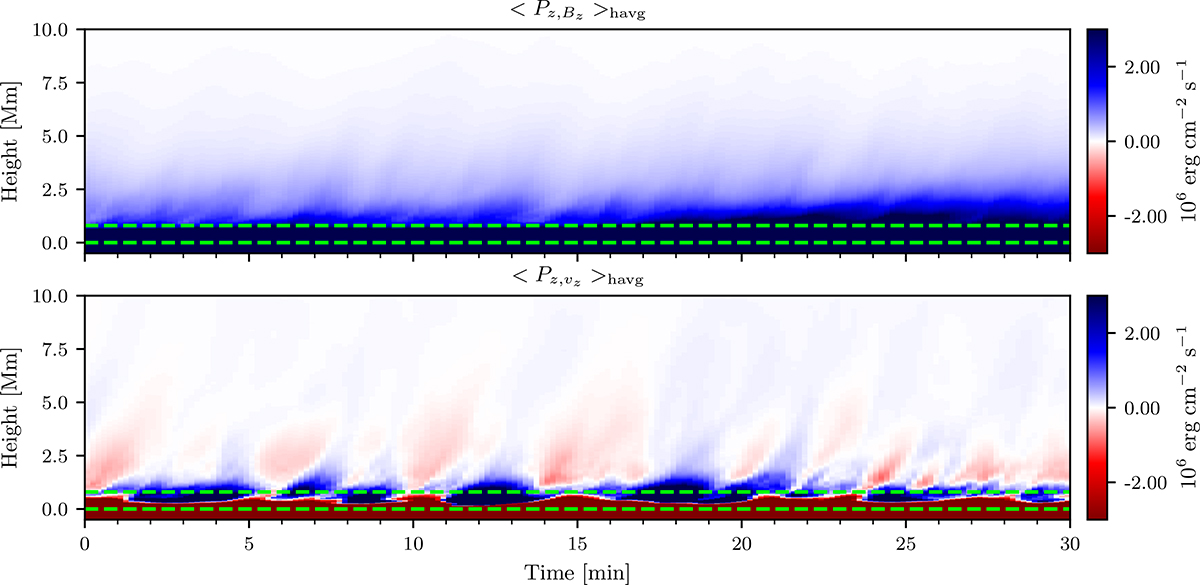
Time-distance image of the of the horizontal averages of a) the shear (wave) −Bz(vxBx + vyBy) and b) the flux advection vzBh2 components of the vertical Poynting flux. The horizontal dashed lines represent the photosphere z = 0 and base of the chromosphere ⟨τ500⟩havg = 10−5.
Current usage metrics show cumulative count of Article Views (full-text article views including HTML views, PDF and ePub downloads, according to the available data) and Abstracts Views on Vision4Press platform.
Data correspond to usage on the plateform after 2015. The current usage metrics is available 48-96 hours after online publication and is updated daily on week days.
Initial download of the metrics may take a while.