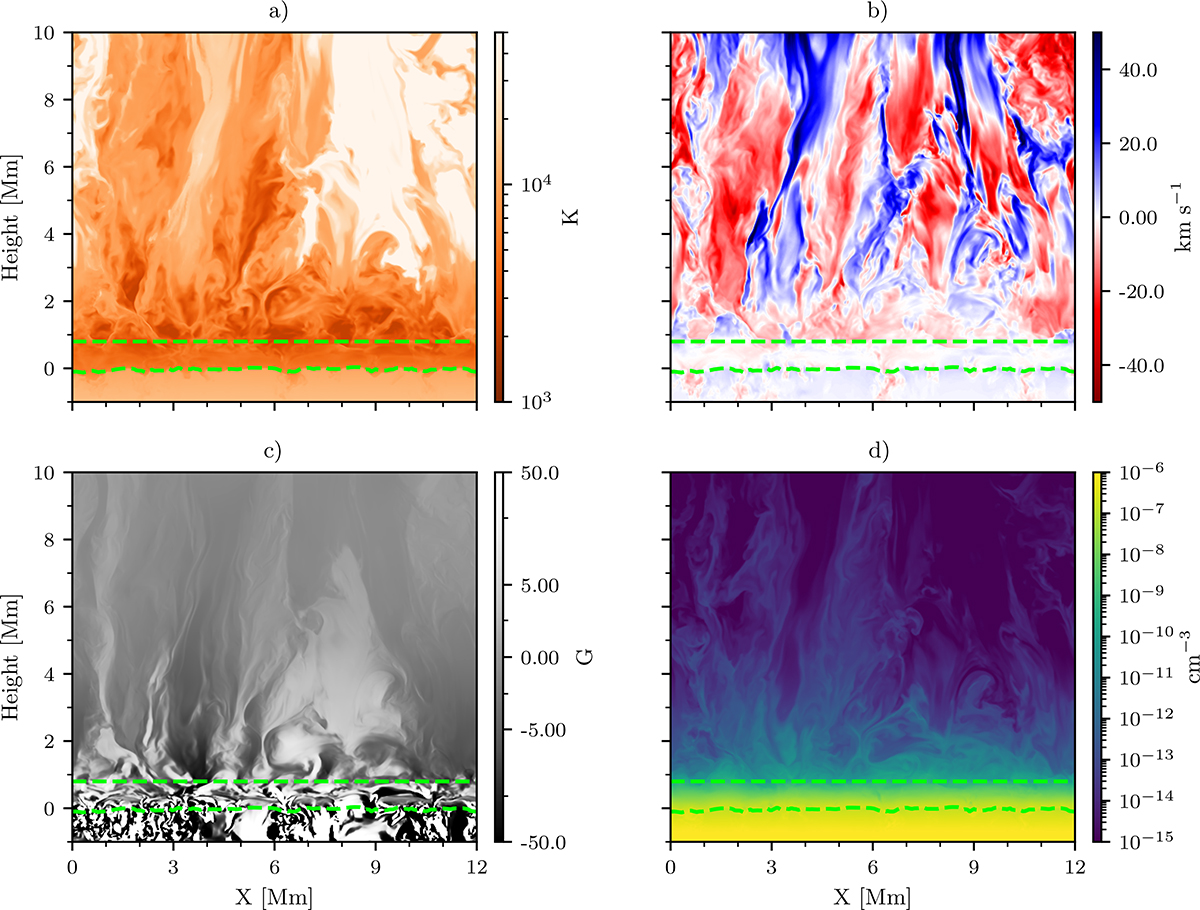
Fig. 2.
Download original image
Vertical slice through the simulation taken in the xz plane at y = 6 Mm. Panel a) Temperature; b) Vertical velocity; c) Vertical magnetic field; and d) Plasma density. We used an arcsinh norm for the magnetic field, and limit all panels to highlight the chromosphere. The horizontal dashed lines represent the photosphere τ500 = 0 and base of the chromosphere z = 0.8 Mm. Animation available online; the image represents t = 0 of the animation.
Current usage metrics show cumulative count of Article Views (full-text article views including HTML views, PDF and ePub downloads, according to the available data) and Abstracts Views on Vision4Press platform.
Data correspond to usage on the plateform after 2015. The current usage metrics is available 48-96 hours after online publication and is updated daily on week days.
Initial download of the metrics may take a while.