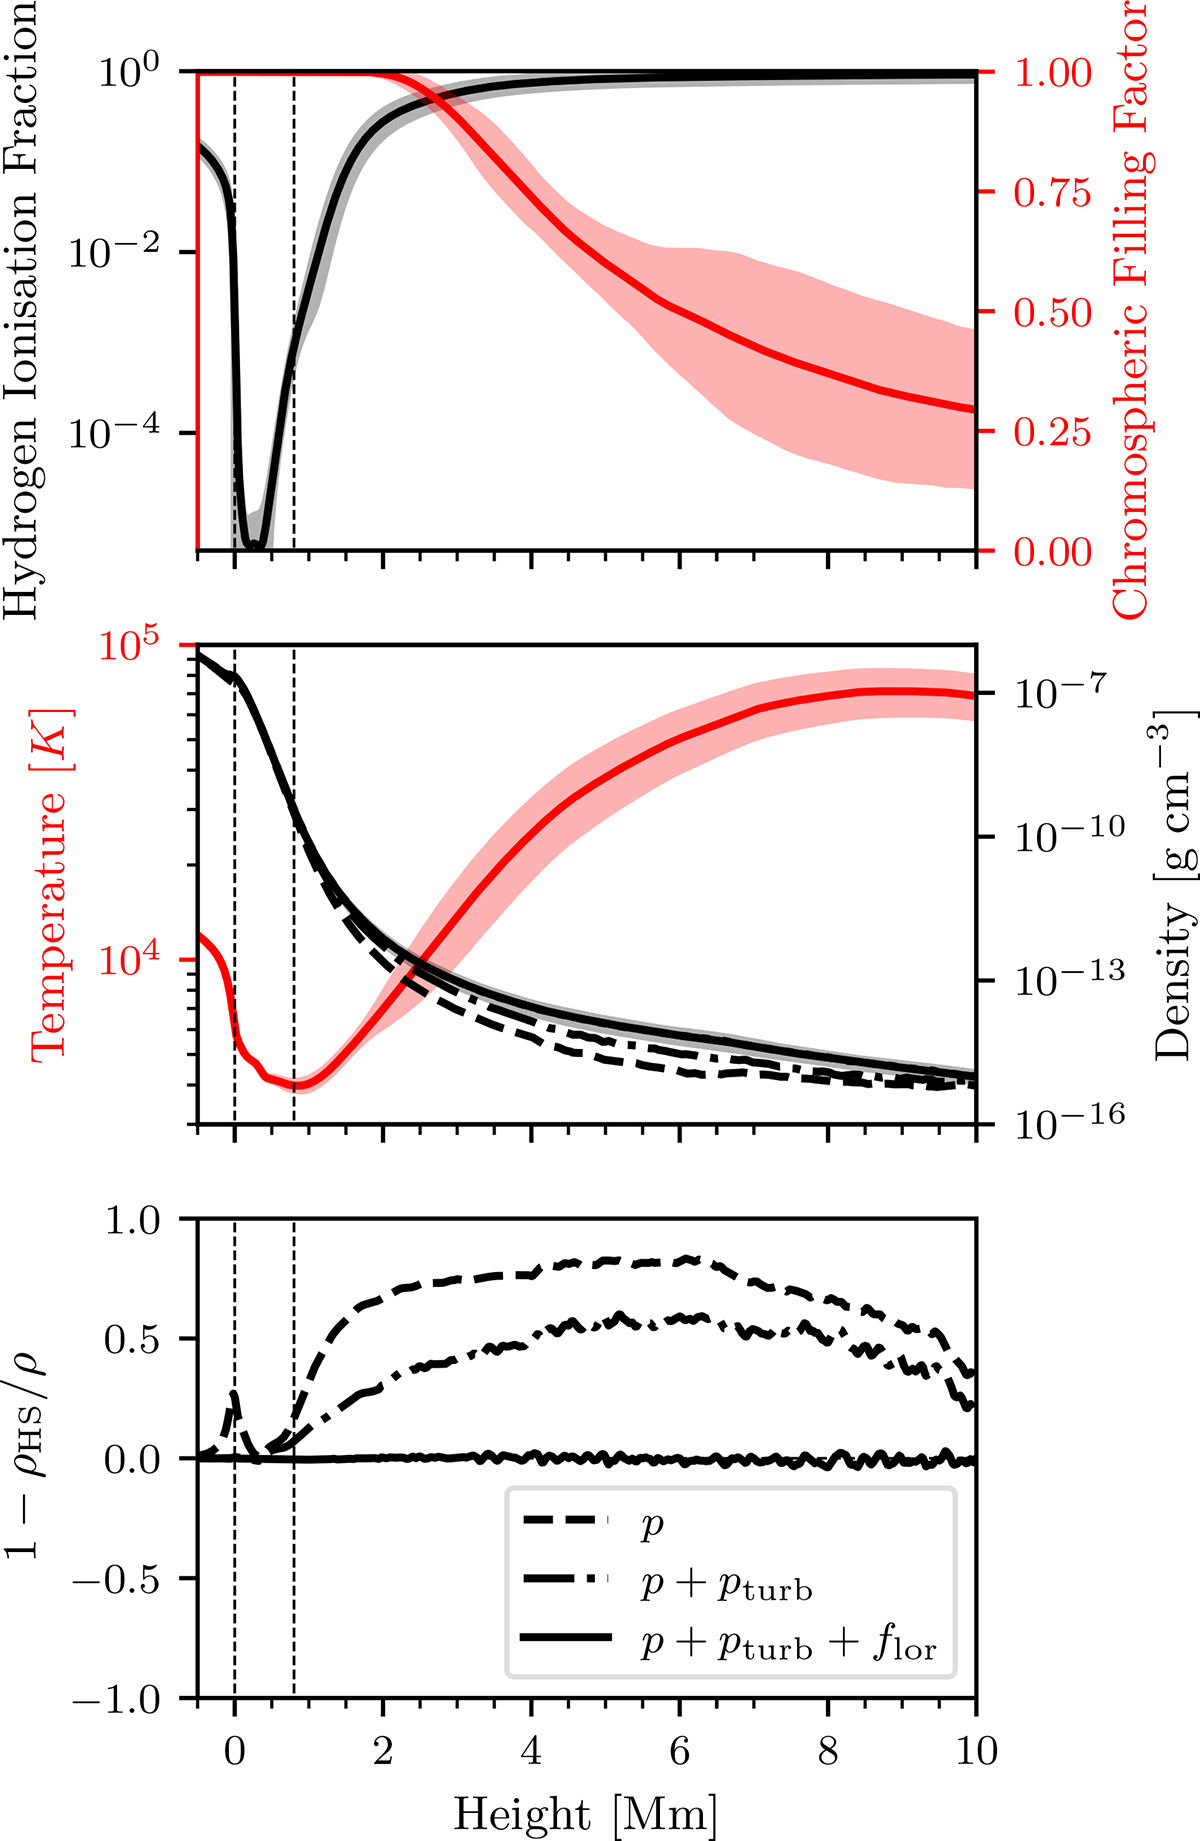
Fig. 3.
Download original image
Horizontally and temporally averaged thermodynamic properties of the simulated chromosphere. Top: Hydrogen ionisation fraction and chromospheric filling factor, which is the area fraction at each height with a temperature below 20 kK. Middle: Temperature (red) and density (black). The shaded areas cover two standard deviations around the mean. The density recovered from hydrostatic equilibrium is included in the middle panel. This was calculated including only the gas pressure (dashed); the gas and turbulent pressures (dash-dotted); and the gas pressure, turbulent pressure, and magnetic term (indistinguishable from the averaged density). Bottom: Error in the density calculated recovered with the hydrostatic equilibrium approximation. The vertical dashed lines represent the photosphere (z = 0 Mm) and the base of the chromosphere (z = 0.8 Mm).
Current usage metrics show cumulative count of Article Views (full-text article views including HTML views, PDF and ePub downloads, according to the available data) and Abstracts Views on Vision4Press platform.
Data correspond to usage on the plateform after 2015. The current usage metrics is available 48-96 hours after online publication and is updated daily on week days.
Initial download of the metrics may take a while.