Fig. 9.
Download original image
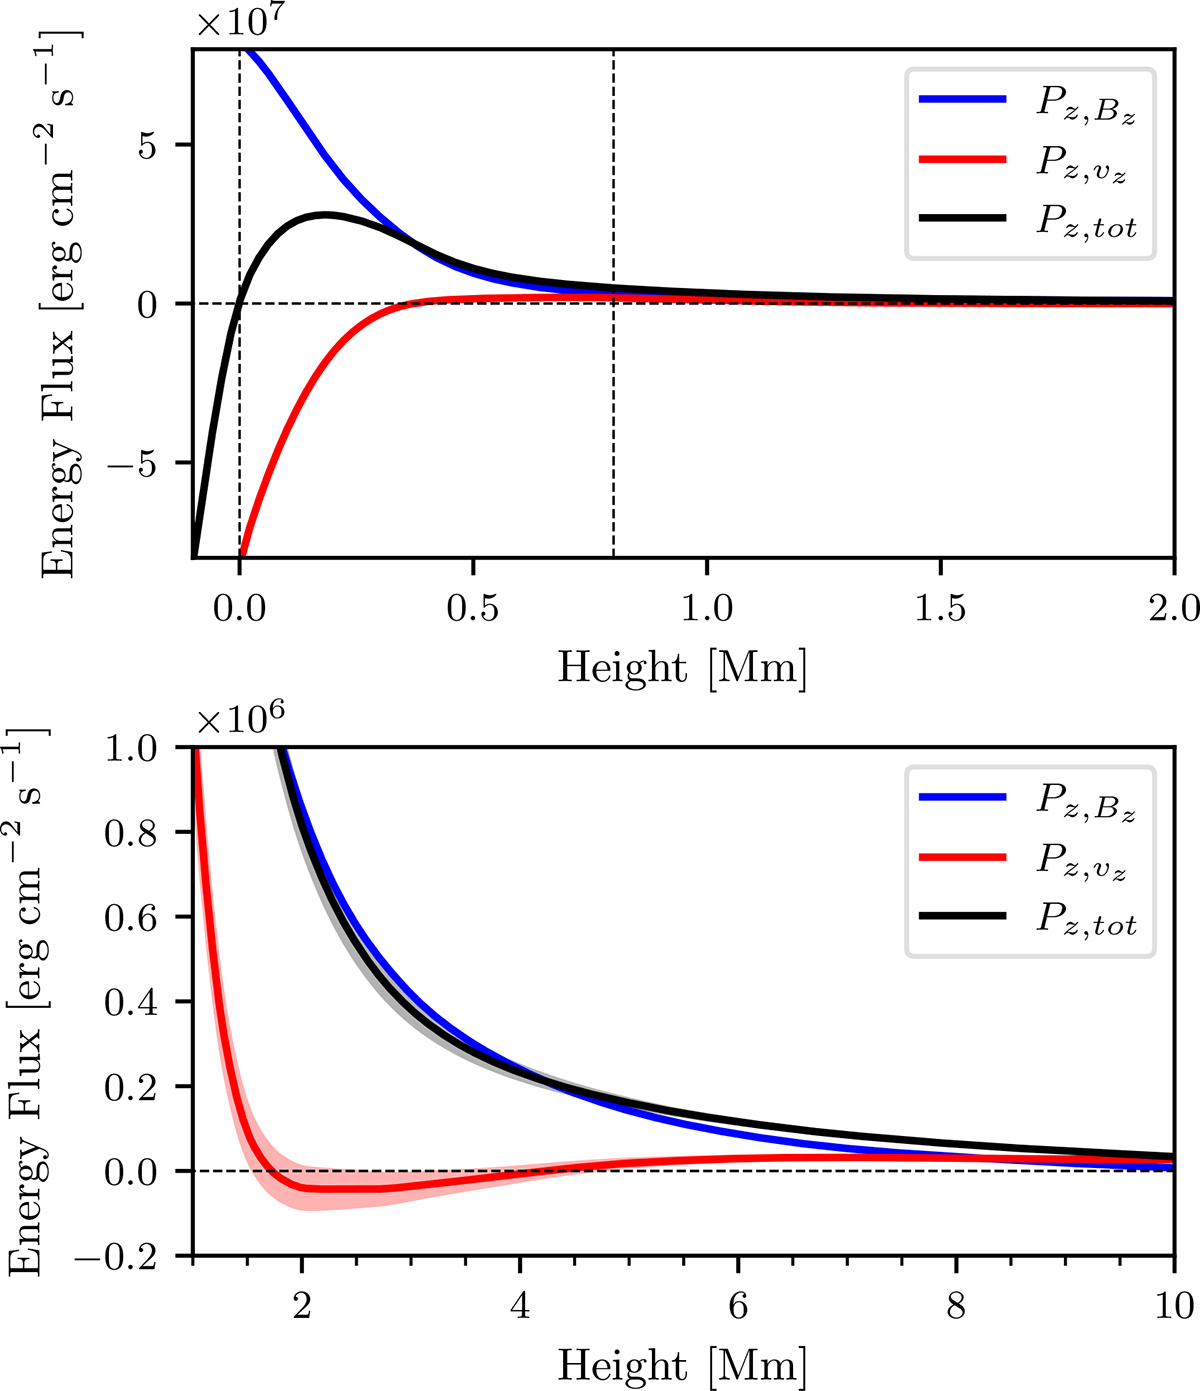
Horizontally and temporally averaged values of the vertical Poynting flux in the solar atmosphere. The top panel shows its stratification in the photosphere and low chromosphere and the bottom panel displays its behaviour in the chromosphere and above on an expanded vertical scale. The blue line shows the shear (wave) −Bz(vxBx + vyBy), the red line the flux advection vzBh2, and the black line the total vertical Poynting flux. The solid lines show the mean value and the shaded area shows two standard deviations.
Current usage metrics show cumulative count of Article Views (full-text article views including HTML views, PDF and ePub downloads, according to the available data) and Abstracts Views on Vision4Press platform.
Data correspond to usage on the plateform after 2015. The current usage metrics is available 48-96 hours after online publication and is updated daily on week days.
Initial download of the metrics may take a while.