Fig. C.1
Download original image
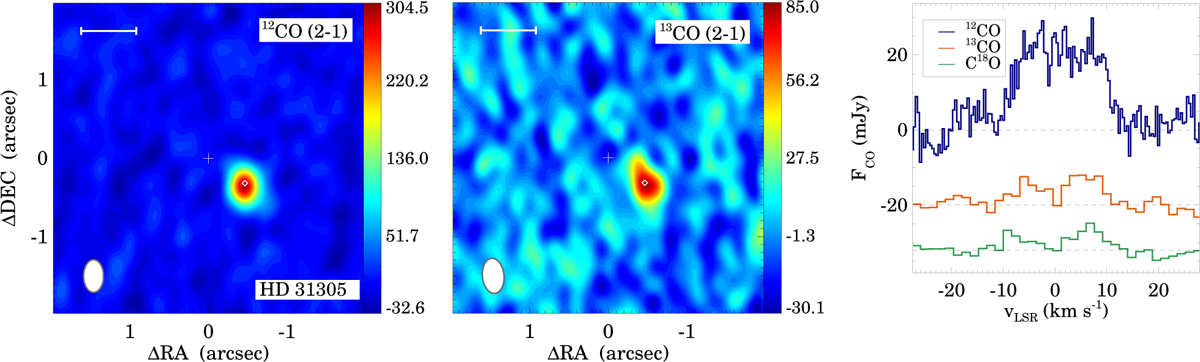
Left and middle panels: 12CO and 13CO J=2–1 moment 0 maps for HD 31305 B, respectively. At the bottom left of each panel the filled white ellipse shows the beam size. The length of the horizontal white bars correspond to 100 au. The white plus sign shows the position of HD 31305 A, while the white diamond displays the position of HD 31305 B. The color bar units are mJy beam−1 km s−1. The right panel displays the obtained CO spectra in all three isotopologs. For clarity, the 13CO and C18O spectra have been shifted downward. The horizontal dashed lines show the zero flux levels of the spectra.
Current usage metrics show cumulative count of Article Views (full-text article views including HTML views, PDF and ePub downloads, according to the available data) and Abstracts Views on Vision4Press platform.
Data correspond to usage on the plateform after 2015. The current usage metrics is available 48-96 hours after online publication and is updated daily on week days.
Initial download of the metrics may take a while.