Fig. 2
Download original image
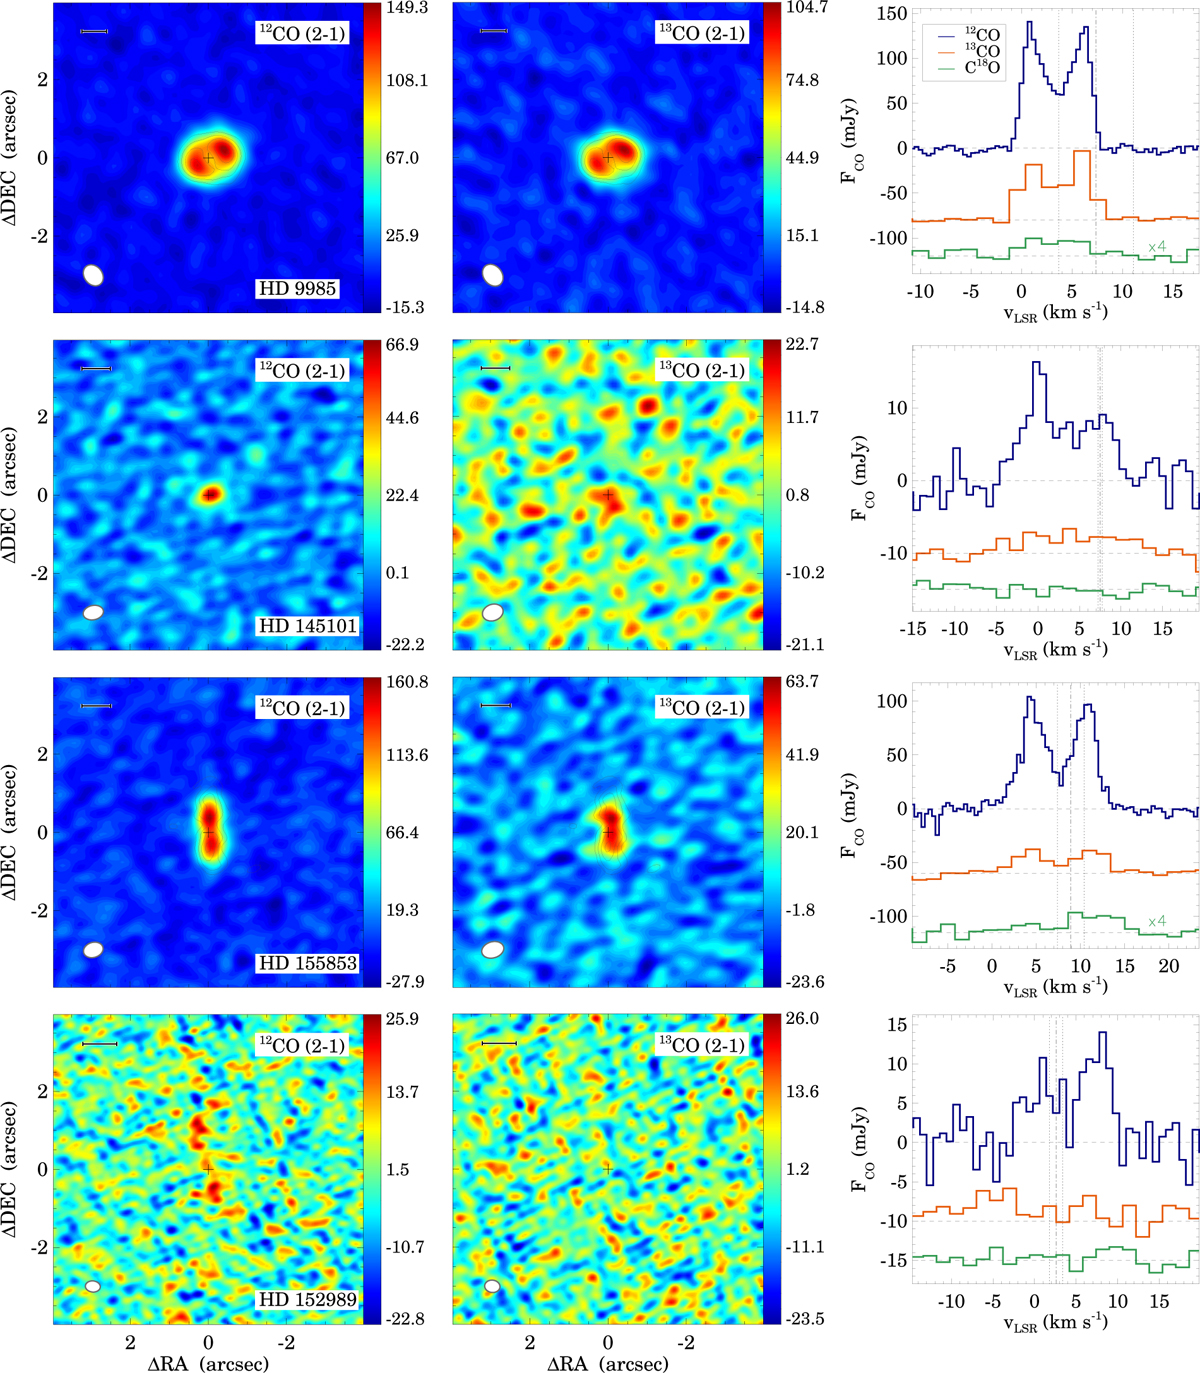
12CO (2–1) and 13CO (2–1) moment 0 maps for HD 9985, HD 145101, HD 155853, and HD 152989 (left and middle columns). At the bottom left of each panel the filled white ellipse shows the beam size. The length of the horizontal black bars corresponds to 100 au. The color bar units are mJy beam−1 km s−1. The contours plotted over the moment 0 maps of HD 9985 and HD 155853 show the continuum emission. The contour levels are in steps of [5,8,11,14,17]× rms noise of 15.9 μJy beam−1 for HD 9985 and [4,6,8,10]× rms−1 noise of 15.3 μJy beam−1 for HD 155853. The right column displays the obtained CO spectra in all three isotopologs. For better visibility, the 13CO and C18O spectra have been shifted downward, and in the case of HD 9985 and HD 155853 the C18O spectrum has been multiplied by 4. The horizontal dashed lines show the zero flux levels of the spectra. The vertical dash-dotted and dotted lines mark the radial velocity of the star and its uncertainty in the LSR frame.
Current usage metrics show cumulative count of Article Views (full-text article views including HTML views, PDF and ePub downloads, according to the available data) and Abstracts Views on Vision4Press platform.
Data correspond to usage on the plateform after 2015. The current usage metrics is available 48-96 hours after online publication and is updated daily on week days.
Initial download of the metrics may take a while.