Fig. 3
Download original image
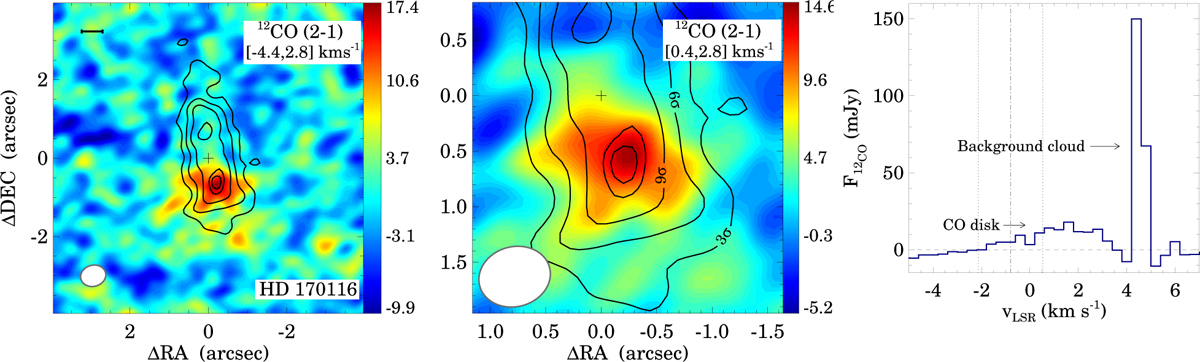
Left panel: integrated 12CO (2–1) intensity map of HD 170116 between vLSR of −4.4 and +2.8 km s−1, using natural weighted data. The applied velocity interval was calculated under the assumption that the possible gas material is co-located with the detected dust (Sect. 5.1). The color bar units are mJy beam−1 km s−1. The moment 0 map is overlaid by the contours of the natural-weighted continuum image of the source. The contour levels are at 3, 6, 9, 12, and 13× rms of the continuum image. The white ellipse in the lower left corner shows the synthetic beam. The size of the horizontal black bar in the upper left corner corresponds to 100 au. The black plus sign indicates the position of the star. Center panel: Same as the left panel, but zoomed in to the center of the observed localized CO brightness peak and using a narrower integration velocity range from +0.4 and +2.8 km s−1, corresponding to the interval in which the emission is detected. Right panel: Spectrum of the observed CO peak. The vertical dash-dotted and dotted lines mark the radial velocity of the star and its uncertainty in the LSR frame.
Current usage metrics show cumulative count of Article Views (full-text article views including HTML views, PDF and ePub downloads, according to the available data) and Abstracts Views on Vision4Press platform.
Data correspond to usage on the plateform after 2015. The current usage metrics is available 48-96 hours after online publication and is updated daily on week days.
Initial download of the metrics may take a while.