Fig. 4
Download original image
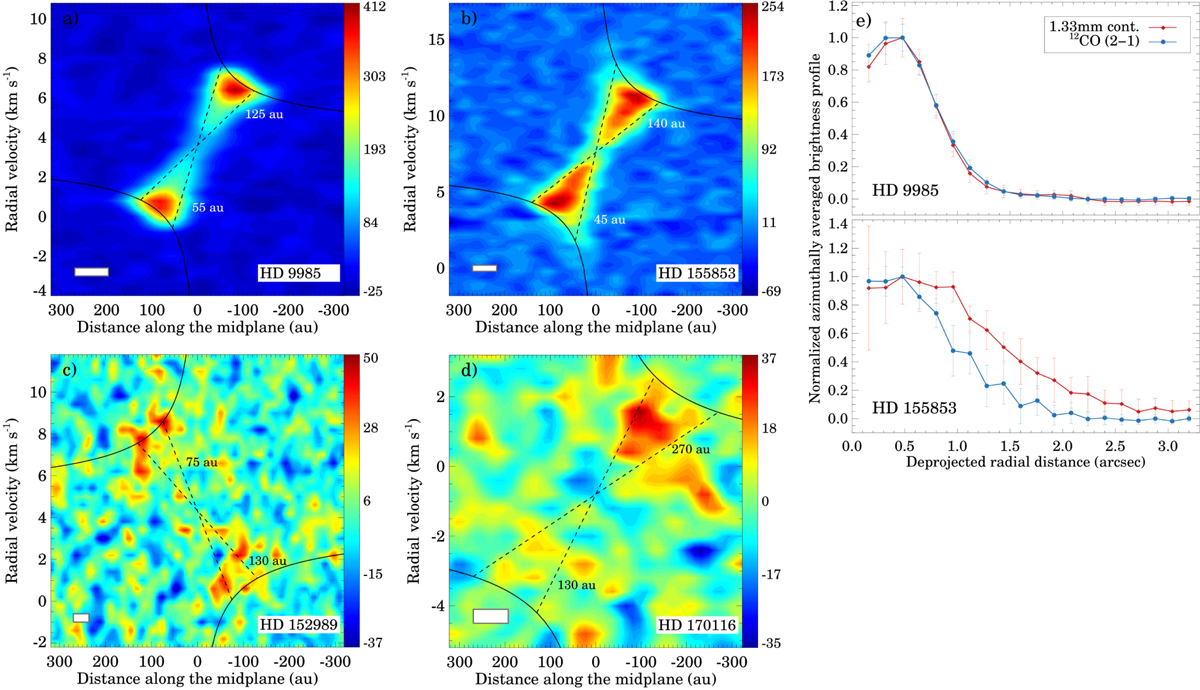
Panels a–d: position–velocity diagrams of 12CO (2–1) emission for HD 9985 (a), HD 155853 (b), HD 152989 (c), and HD 170116 (d). The color bar units are mJy beam−1 channel−1. The black solid curves show the tangential velocity of the gas, while the black dashed diagonal lines display the line-of-sight velocity of the gas at a fixed orbital radius as a function of projected separation. To derive these, we assumed a Keplerian rotation profile for the gas, the distance and mass of the star are from Table 1, and the position angle and inclination of the gas disk are from Sect. 5.3. The white rectangle at the bottom left represents the spectro-spatial resolution. Panel e: Azimuthally averaged radial profile for the continuum and 12CO (2–1) data for HD 9985 (top) and HD 155853 (bottom). For comparison, the profiles are normalized to unity.
Current usage metrics show cumulative count of Article Views (full-text article views including HTML views, PDF and ePub downloads, according to the available data) and Abstracts Views on Vision4Press platform.
Data correspond to usage on the plateform after 2015. The current usage metrics is available 48-96 hours after online publication and is updated daily on week days.
Initial download of the metrics may take a while.