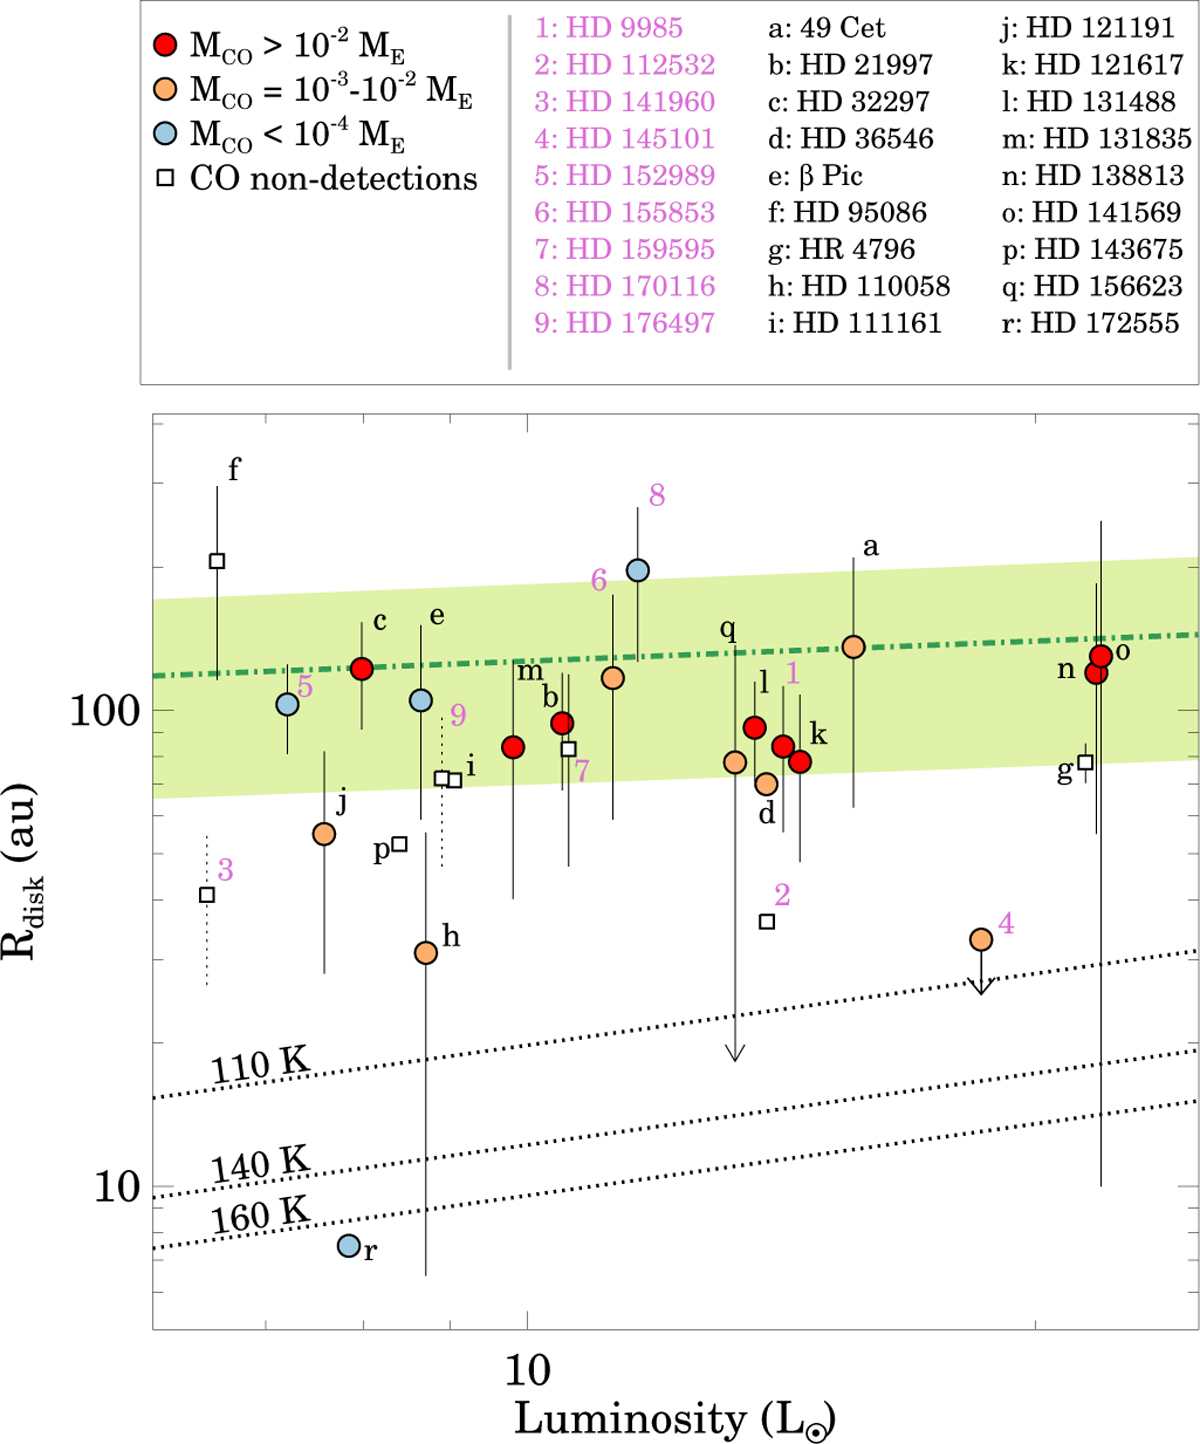
Fig. 7
Download original image
Radii of dust disks as a function of stellar luminosities. In addition to the 9 disks we detected (indicated by numbers), 17 additional previously identified debris disk systems (indicated by letters) are also displayed. The data for the latter objects are from Table D.1. The vertical bars represent the radial extent of the disks. For disks where the width parameter was fixed in the modeling, the bars are shown by dotted lines. In the case of HD 156623 (marked by q) only an upper limit is available for the position of the inner edge of the disk. With the exception of HD 111161 (i), HD 143675 (p), and HD 172555 (r), the size estimates are derived from millimeter continuum observations. Different symbols indicate those systems where CO gas is detected and those where it is not, and within the first group three categories are further distinguished by CO mass estimates. The green dashed-dotted line represents the best fit of the empirical planetesimal belt radius–stellar luminosity relationship (Matrà et al. 2025), while the green shaded region shows the ±68% confidence taking into account both the intrinsic scatter as well as the uncertainties of the obtained parameters.
Current usage metrics show cumulative count of Article Views (full-text article views including HTML views, PDF and ePub downloads, according to the available data) and Abstracts Views on Vision4Press platform.
Data correspond to usage on the plateform after 2015. The current usage metrics is available 48-96 hours after online publication and is updated daily on week days.
Initial download of the metrics may take a while.