Open Access
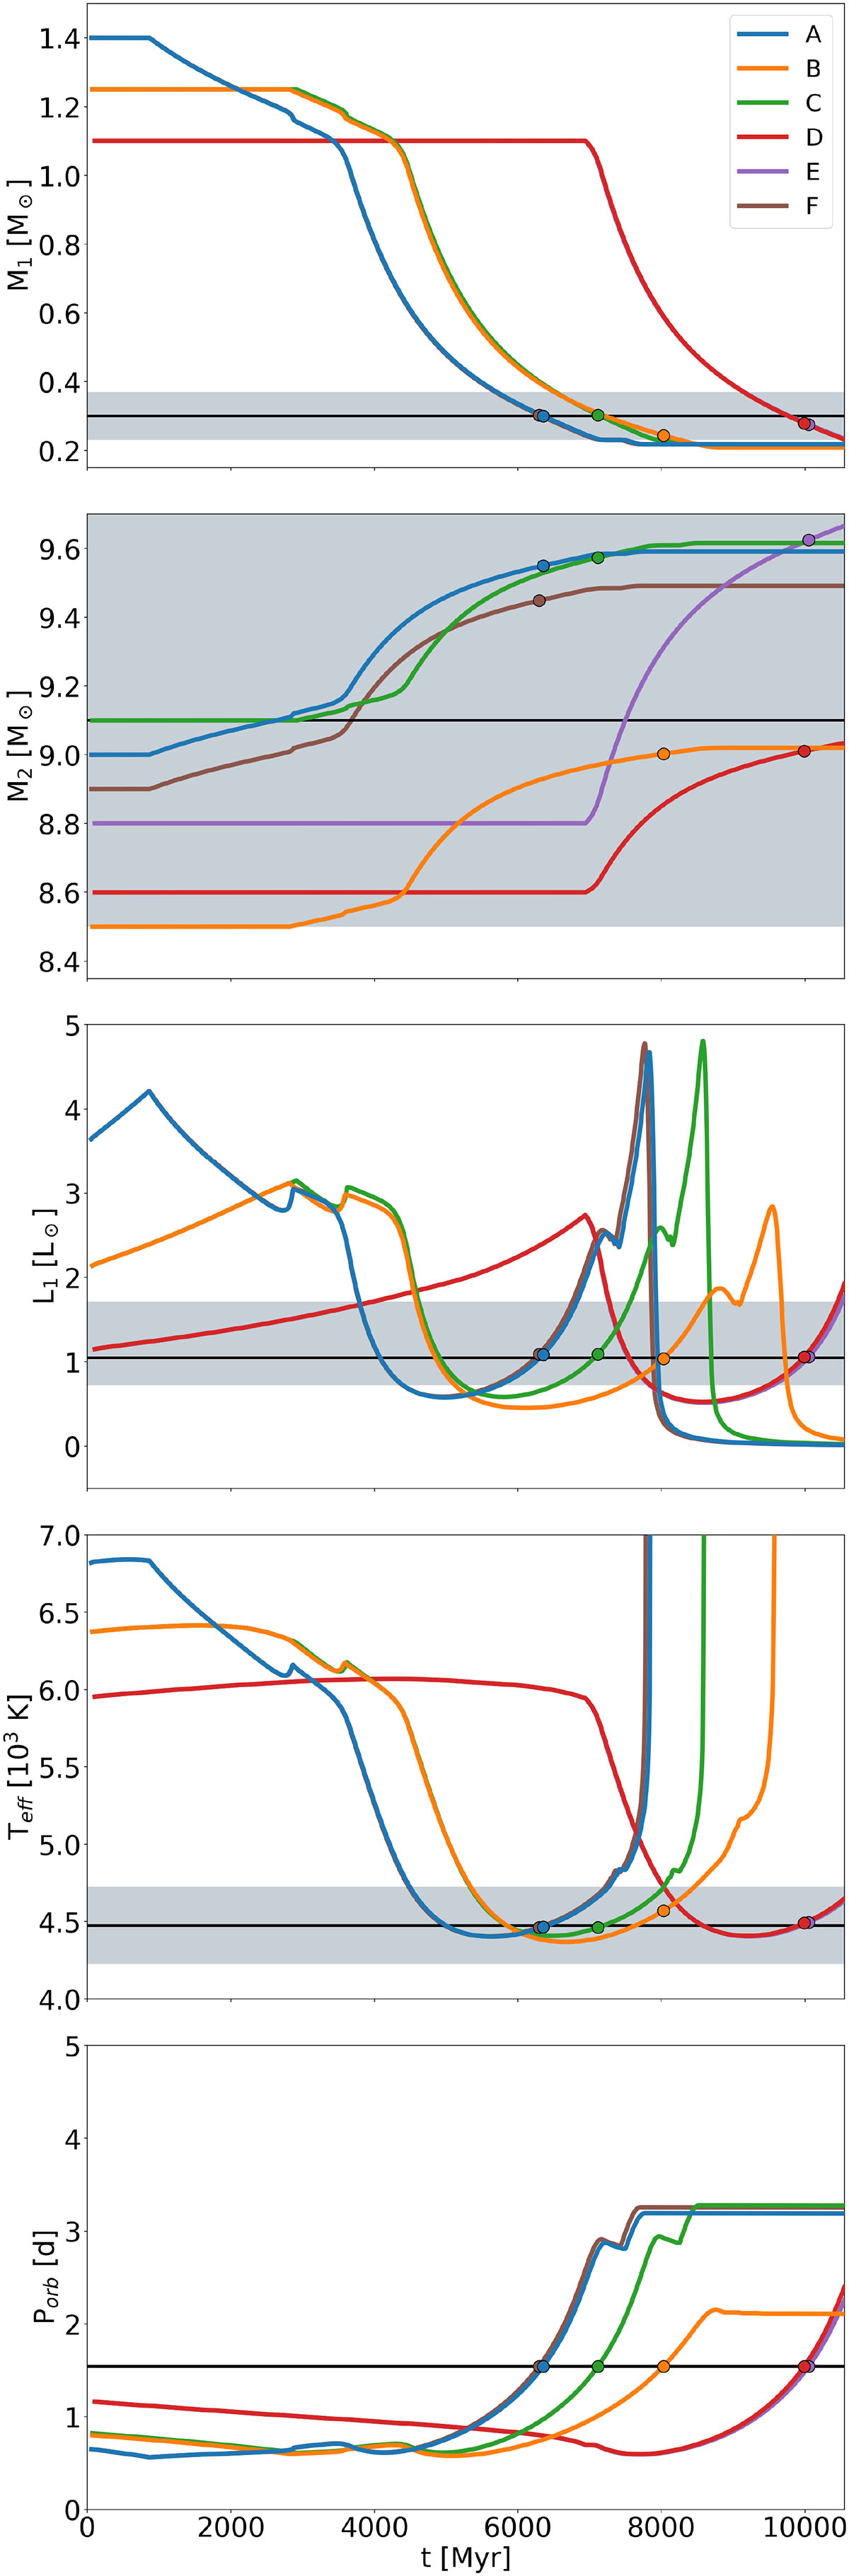
Fig. 1.
Download original image
Evolution of fundamental quantities as a function of time for the models listed in Table 2. Observed values are indicated by horizontal black lines, with their respective errors represented by the shaded gray area. Each point on the graph corresponds to when the model reaches the tobs value.
Current usage metrics show cumulative count of Article Views (full-text article views including HTML views, PDF and ePub downloads, according to the available data) and Abstracts Views on Vision4Press platform.
Data correspond to usage on the plateform after 2015. The current usage metrics is available 48-96 hours after online publication and is updated daily on week days.
Initial download of the metrics may take a while.