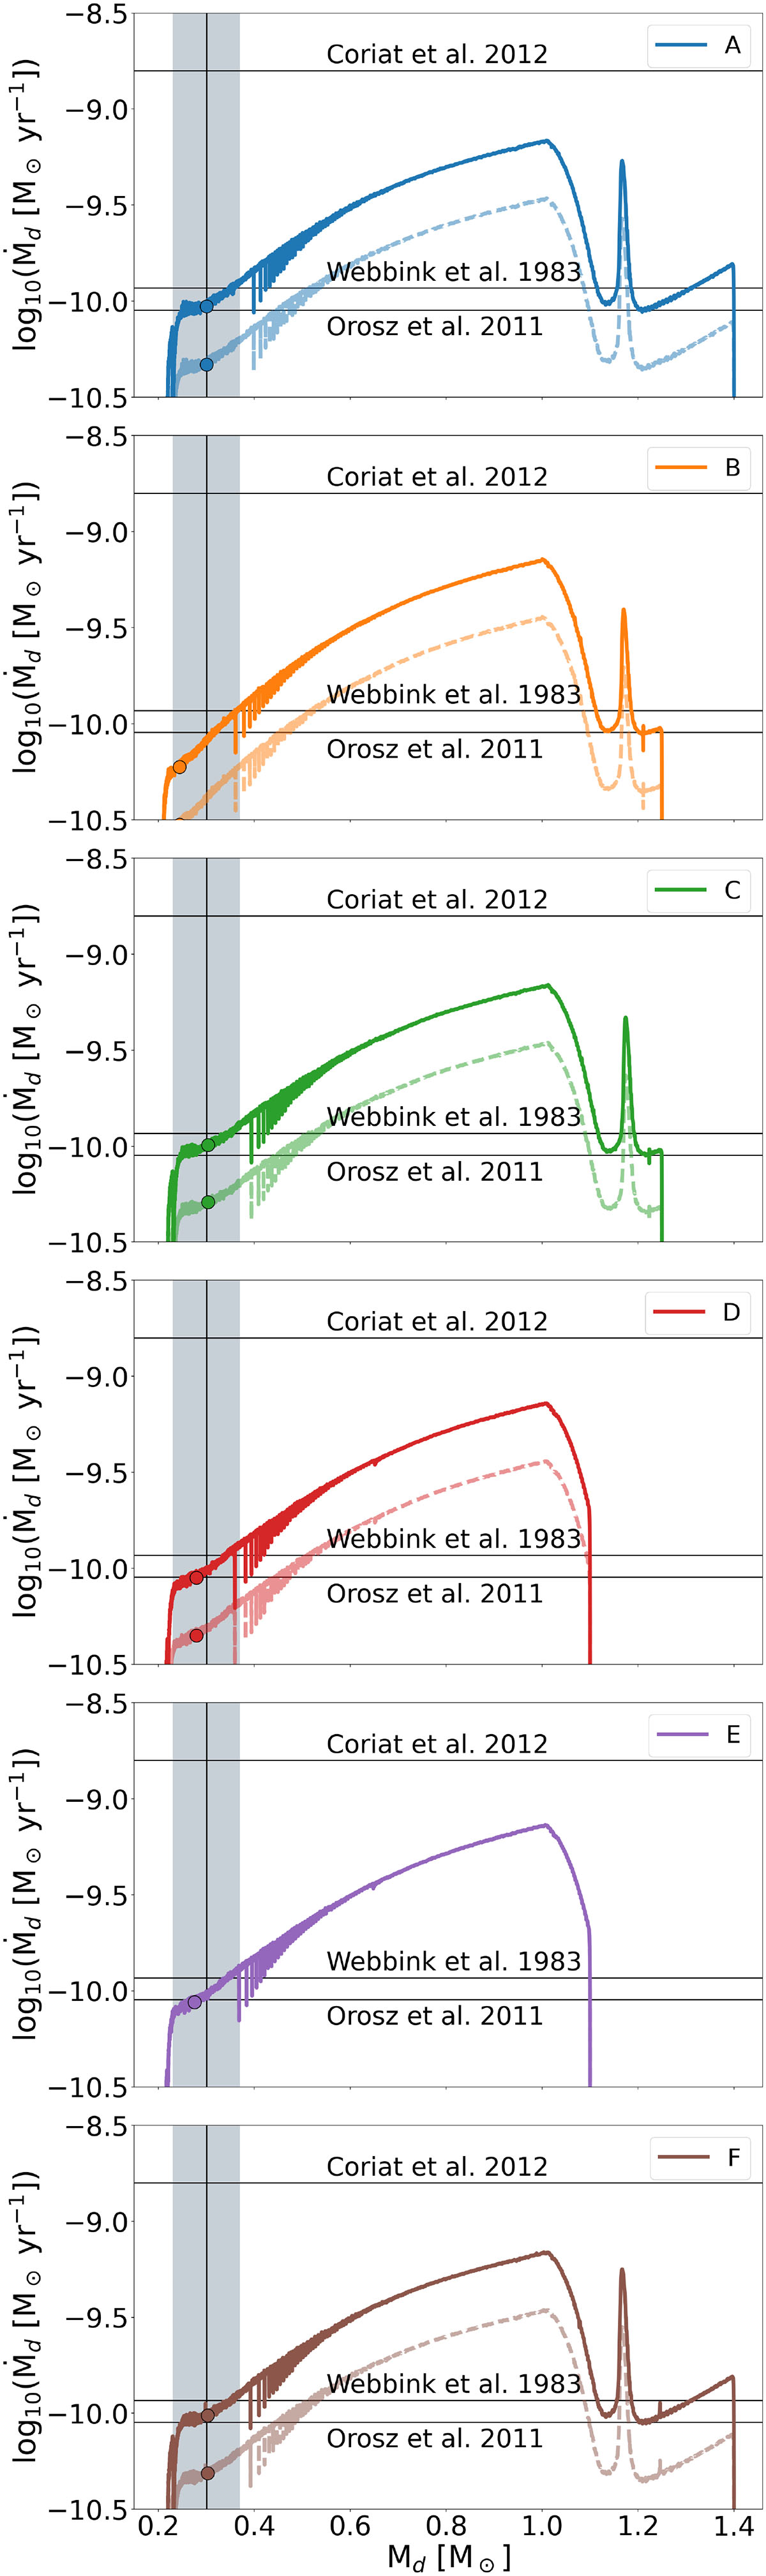
Fig. 3.
Download original image
Absolute value of the mass loss rate (full line) and mass accretion rate (dashed line) as a function of the donor’s mass for the best models. Horizontal black lines represent the estimations for the mass loss rate derived from the works of C+12, O+11 and the estimation we obtained with Webbink et al. (1983). The donor’s mass (Md = 0.3 M⊙) is indicated by a vertical black line, with a shaded area representing the observational error. The dots depict the donor’s mass and mass loss rate (or mass accretion rate) at tobs for each model.
Current usage metrics show cumulative count of Article Views (full-text article views including HTML views, PDF and ePub downloads, according to the available data) and Abstracts Views on Vision4Press platform.
Data correspond to usage on the plateform after 2015. The current usage metrics is available 48-96 hours after online publication and is updated daily on week days.
Initial download of the metrics may take a while.