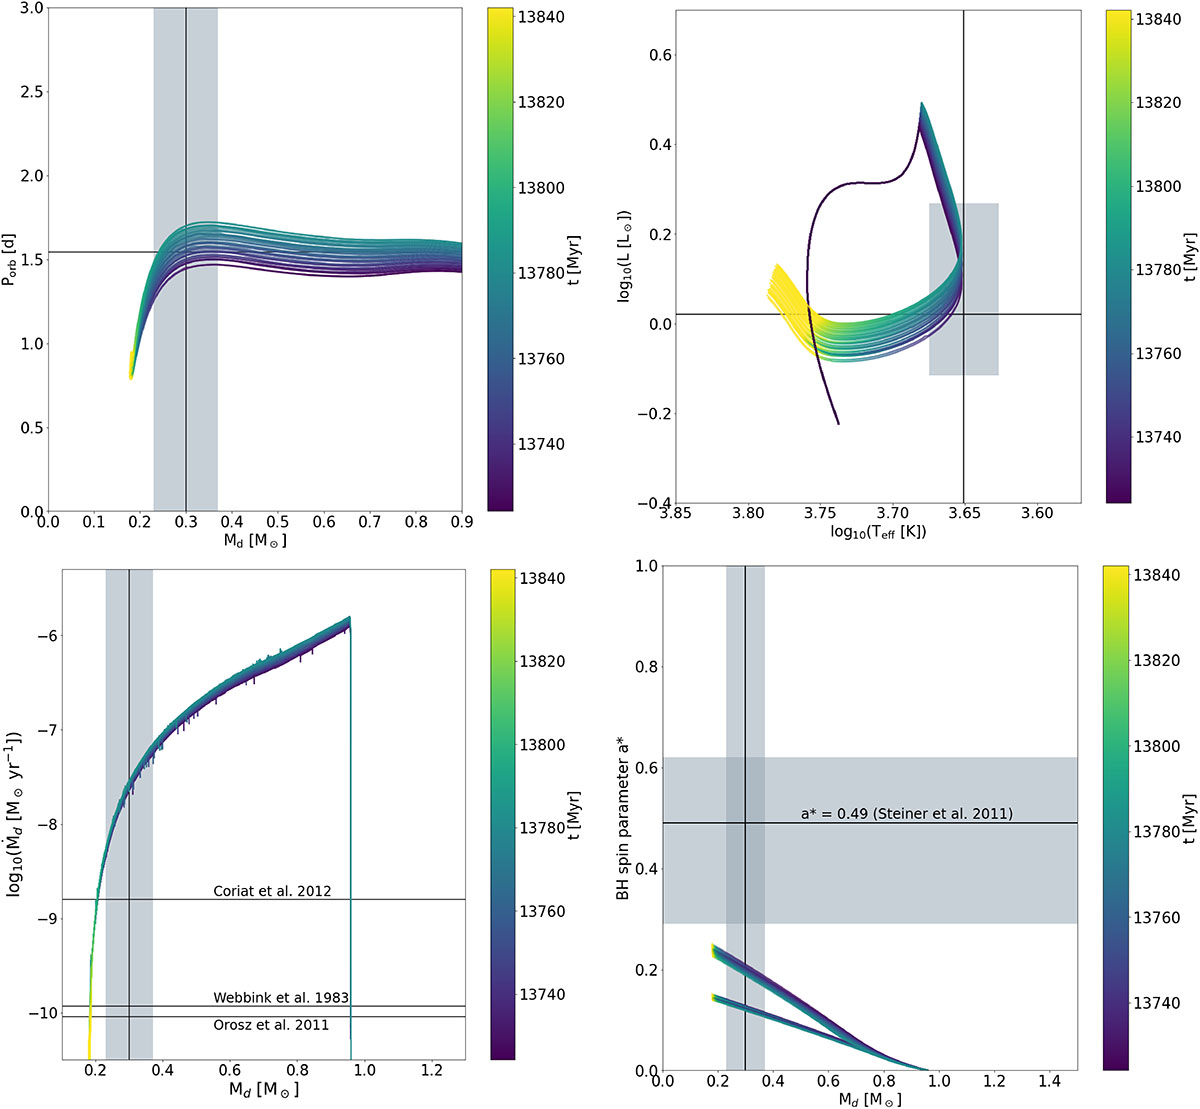
Fig. 5.
Download original image
Evolution of the models computed using the MB3 prescription. Top-left: Donor’s mass vs. orbital period. Top-right: Hertzprung–Russel diagram. Bottom left: Donor’s mass vs. mass transfer rate. Bottom right: Donor’s mass vs. BH spin parameter. Black lines indicate the observed values of the donor mass, luminosity, effective temperature, orbital period, mass transfer rate, and BH spin parameter; shaded grey areas represent their associated uncertainties. The color gradient traces the system’s age during the mass transfer episode.
Current usage metrics show cumulative count of Article Views (full-text article views including HTML views, PDF and ePub downloads, according to the available data) and Abstracts Views on Vision4Press platform.
Data correspond to usage on the plateform after 2015. The current usage metrics is available 48-96 hours after online publication and is updated daily on week days.
Initial download of the metrics may take a while.