Open Access
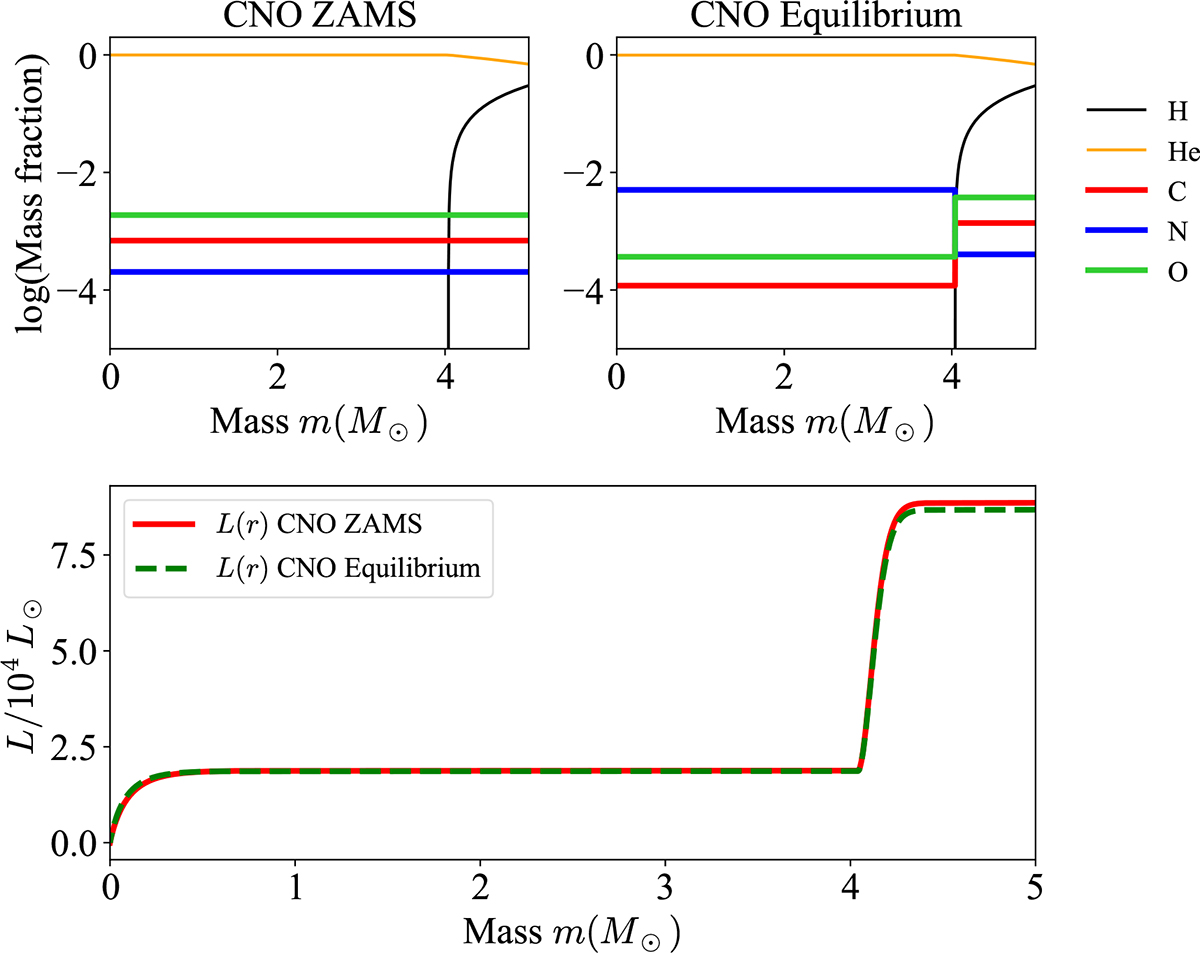
Fig. A.1.
Download original image
Top: Internal chemical profiles showcasing two different CNO abundances: ZAMS values and equilibrium values reflecting higher N in expense of C and O in the He-rich core. Bottom: Luminosity profiles of the two models shown in the top sub-plots.
Current usage metrics show cumulative count of Article Views (full-text article views including HTML views, PDF and ePub downloads, according to the available data) and Abstracts Views on Vision4Press platform.
Data correspond to usage on the plateform after 2015. The current usage metrics is available 48-96 hours after online publication and is updated daily on week days.
Initial download of the metrics may take a while.