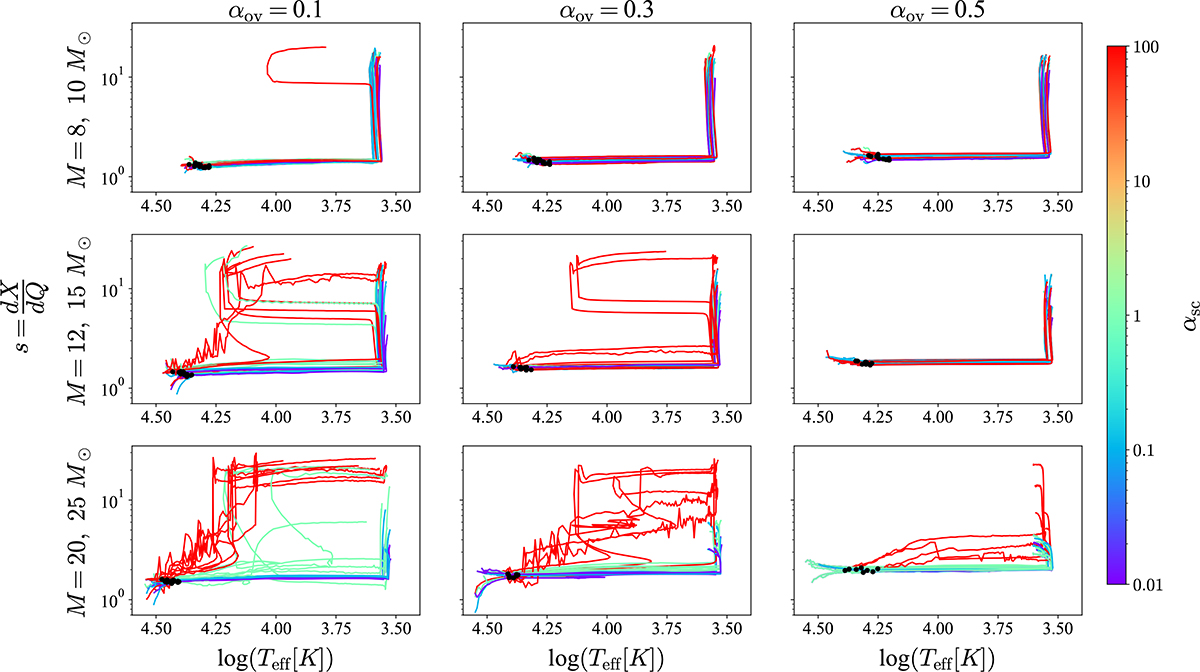
Fig. 2.
Download original image
Evolution of the H-profile slope s = dX/dQ as a function of effective temperature. The evolutionary model grid is built by varying the initial mass, convective overshooting, semiconvective mixing, rotation and initial metallicity (see text for parameter range). The sub-panels are divided based on the input overshooting and initial mass ranges. The tracks are colour-coded based on the input semiconvective efficiency. The black dots mark the end of the MS where central H mass fraction Xc falls below 0.01.
Current usage metrics show cumulative count of Article Views (full-text article views including HTML views, PDF and ePub downloads, according to the available data) and Abstracts Views on Vision4Press platform.
Data correspond to usage on the plateform after 2015. The current usage metrics is available 48-96 hours after online publication and is updated daily on week days.
Initial download of the metrics may take a while.