Fig. 7.
Download original image
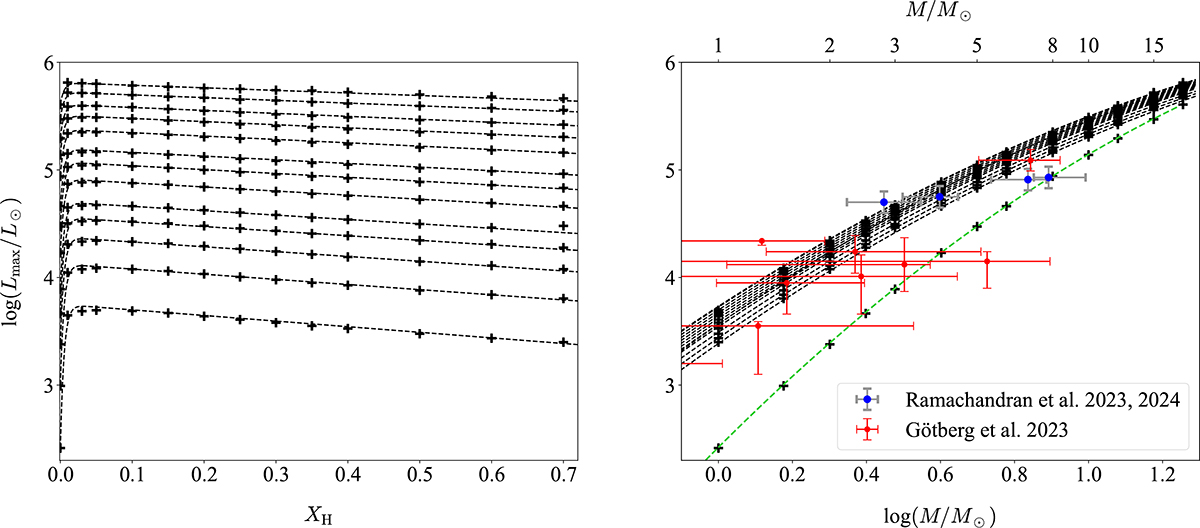
Maximum luminosity for a given total mass and surface XH. Left: Maximum luminosity plotted against surface XH for total masses ranging from 1 M⊙ to 18 M⊙. Right: Maximum luminosity plotted against total mass for XH values ranging from 0 to 0.7. The plus signs indicate maximum luminosities achievable from partially stripped structure models, while the dashed black lines represent our best-fit relations from Eq. 2. The green dashed line in the right sub-panel corresponds to the MLR for pure-He models. Stripped star luminosities and spectroscopic masses from Götberg et al. (2023) and Ramachandran et al. (2023, 2024) are over-plotted.
Current usage metrics show cumulative count of Article Views (full-text article views including HTML views, PDF and ePub downloads, according to the available data) and Abstracts Views on Vision4Press platform.
Data correspond to usage on the plateform after 2015. The current usage metrics is available 48-96 hours after online publication and is updated daily on week days.
Initial download of the metrics may take a while.