Open Access
Fig. 10
Download original image
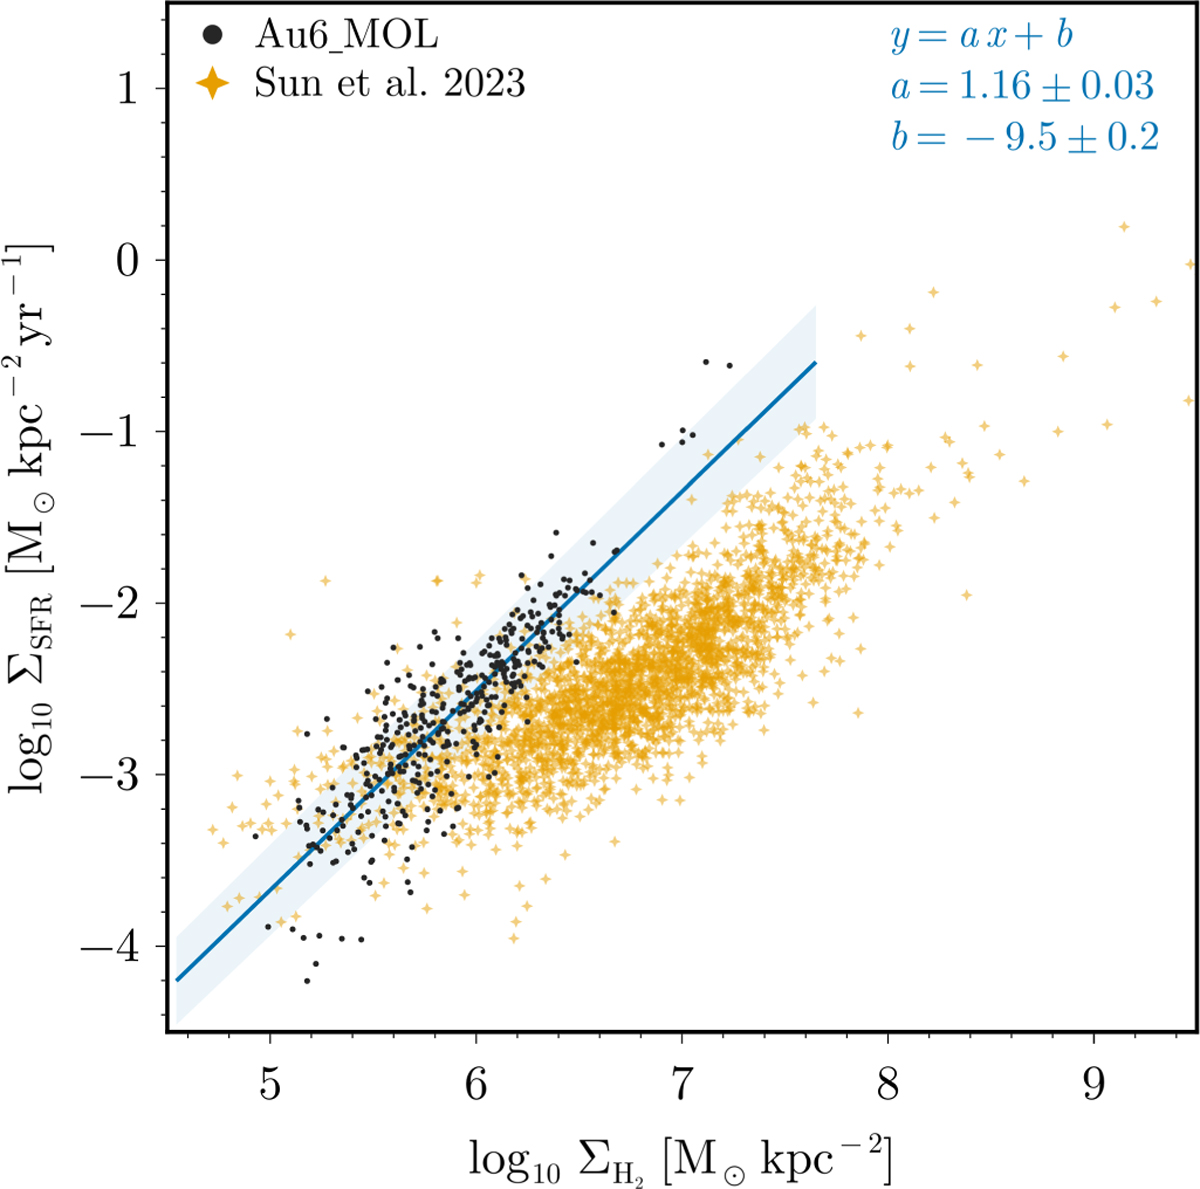
Molecular Kennicutt-Schmidt relation, at z=0, for our simulations Au6_MOL (black dots). Each point corresponds to a 1.5 kpc × 1.5 kpc parcel of a 30 kpc square region centred on the main sub-halo. We also include a linear fit (blue line) for our data points and the observational values of Sun et al. (2023) (orange).
Current usage metrics show cumulative count of Article Views (full-text article views including HTML views, PDF and ePub downloads, according to the available data) and Abstracts Views on Vision4Press platform.
Data correspond to usage on the plateform after 2015. The current usage metrics is available 48-96 hours after online publication and is updated daily on week days.
Initial download of the metrics may take a while.