Fig. 11
Download original image
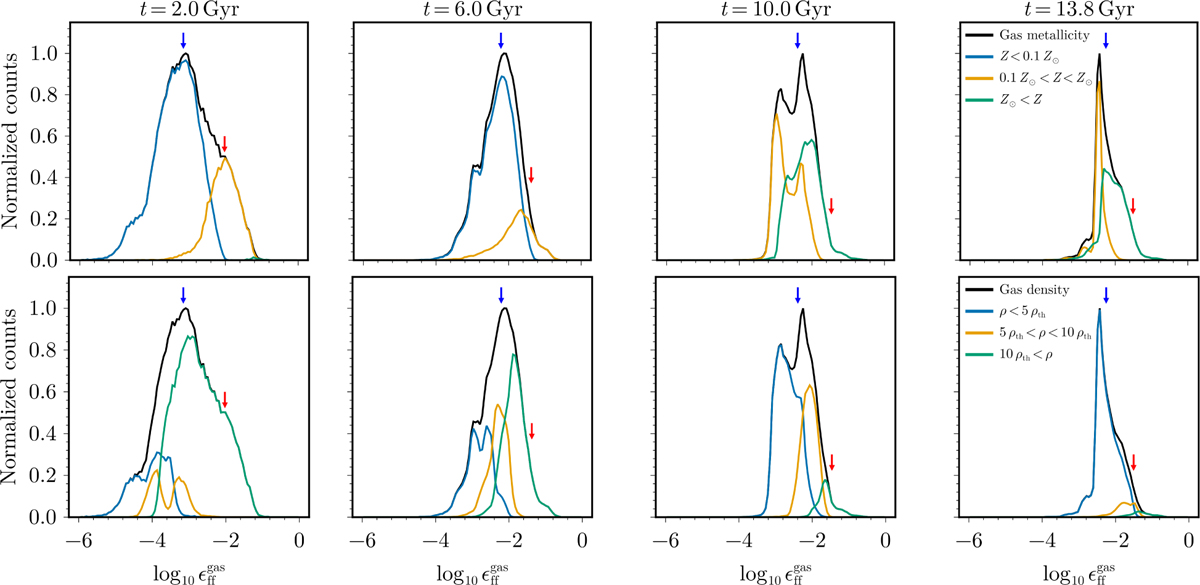
Distribution of the SFE per free fall time of the gas in the disc (r<40 ckpc) of simulation Au6_MOL, at 2, 6, 10, and 13.8 Gyr. The first row shows the distribution separated by metallicity ranges (the colour lines show the ranges while the black lines show the full distribution), and the second row shows the distribution separated by density ranges (ρth in the legend is the density threshold for SF). The blue arrows indicate the median of the total distribution (black line), while the red arrows indicate the median of the distribution for gas that has been transformed into stars (this distribution is not shown).
Current usage metrics show cumulative count of Article Views (full-text article views including HTML views, PDF and ePub downloads, according to the available data) and Abstracts Views on Vision4Press platform.
Data correspond to usage on the plateform after 2015. The current usage metrics is available 48-96 hours after online publication and is updated daily on week days.
Initial download of the metrics may take a while.