Open Access
Fig. 2
Download original image
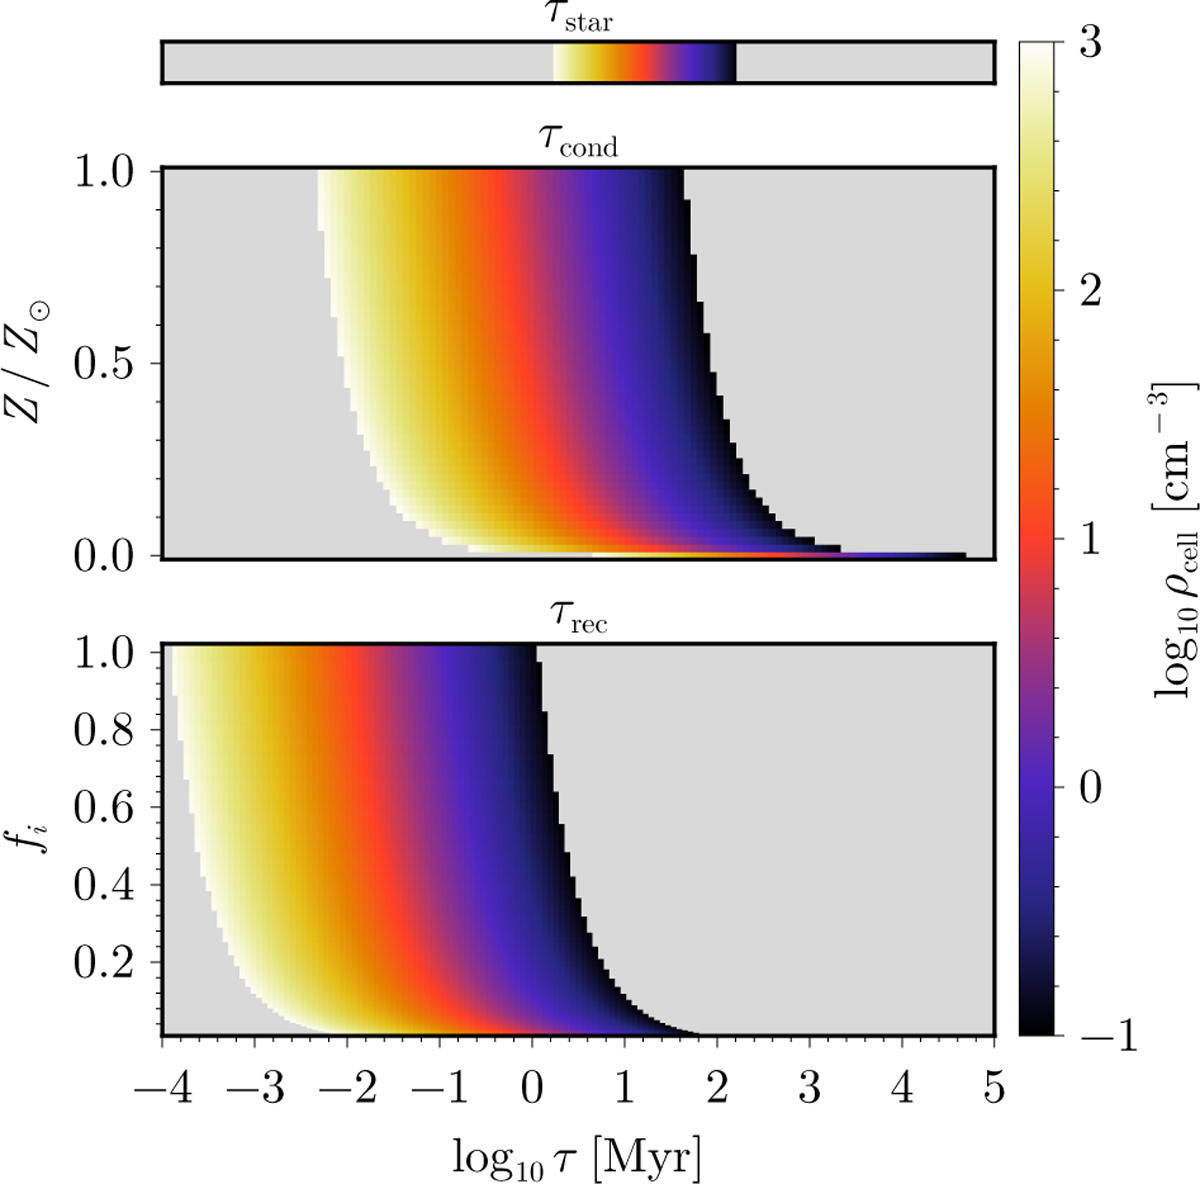
Comparison of the different timescales (τstar, τcond, and τrec) in our model. The colour scale indicates the cell density, and the y-axis the secondary dependency of each timescale when appropriate. τcond depends on the sum fa+fm+fi too (see Section 2.3), but for this plot we take fa+fm+fi=1.0.
Current usage metrics show cumulative count of Article Views (full-text article views including HTML views, PDF and ePub downloads, according to the available data) and Abstracts Views on Vision4Press platform.
Data correspond to usage on the plateform after 2015. The current usage metrics is available 48-96 hours after online publication and is updated daily on week days.
Initial download of the metrics may take a while.