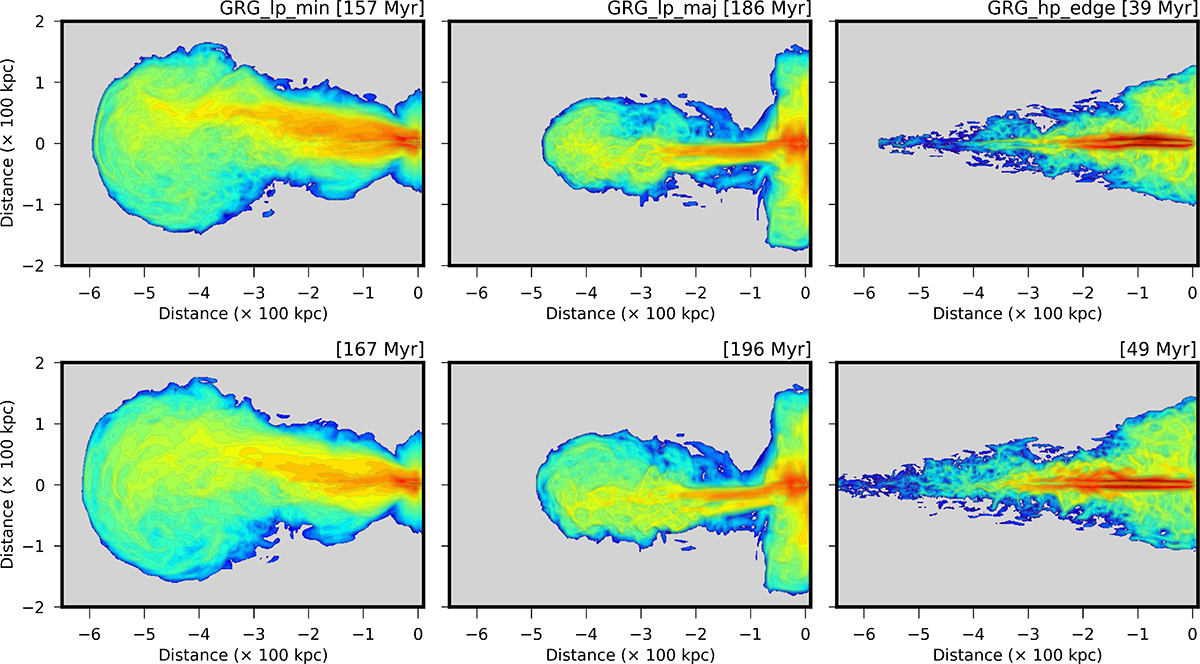
Fig. 13.
Download original image
Emission maps for three simulations (labeled in the sub-figures) at times ∼10 Myr earlier than those presented in Figs. 4(A-C), reiterated in the bottom row. A comparison between these temporal snapshots underscores the dynamic and transient nature of filamentary structures within the cocoon, while also aiding in constraining the typical lifetimes of these multi-scaled internal features. For further details, refer to Section 5.3.
Current usage metrics show cumulative count of Article Views (full-text article views including HTML views, PDF and ePub downloads, according to the available data) and Abstracts Views on Vision4Press platform.
Data correspond to usage on the plateform after 2015. The current usage metrics is available 48-96 hours after online publication and is updated daily on week days.
Initial download of the metrics may take a while.