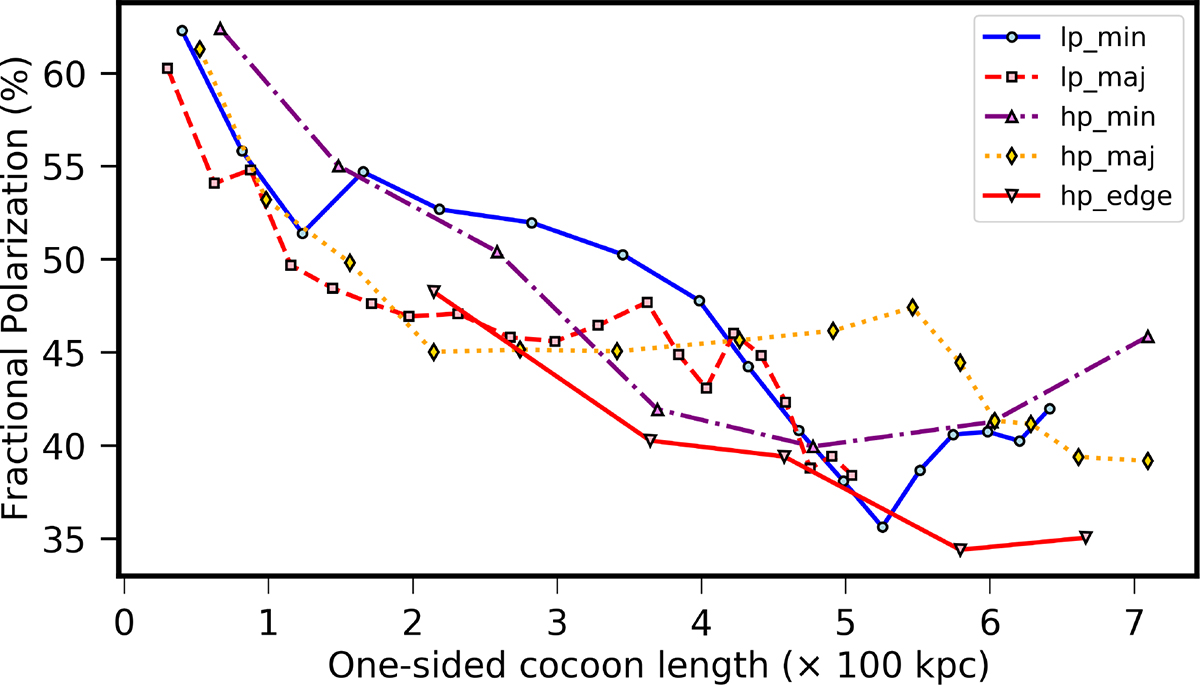
Fig. 16.
Download original image
Evolution of the median FP values in the simulated emission maps for the five situations, plotted against their growing length (mimicking also their aging), illustrating a gradual decrease in FP values followed by a near-settling phase. The FP values are calculated at 1 GHz at a spatial resolution of 1 kpc, corresponding to an angular resolution of 0.9 arcsecond for a redshift of 0.05.
Current usage metrics show cumulative count of Article Views (full-text article views including HTML views, PDF and ePub downloads, according to the available data) and Abstracts Views on Vision4Press platform.
Data correspond to usage on the plateform after 2015. The current usage metrics is available 48-96 hours after online publication and is updated daily on week days.
Initial download of the metrics may take a while.