Fig. 2.
Download original image
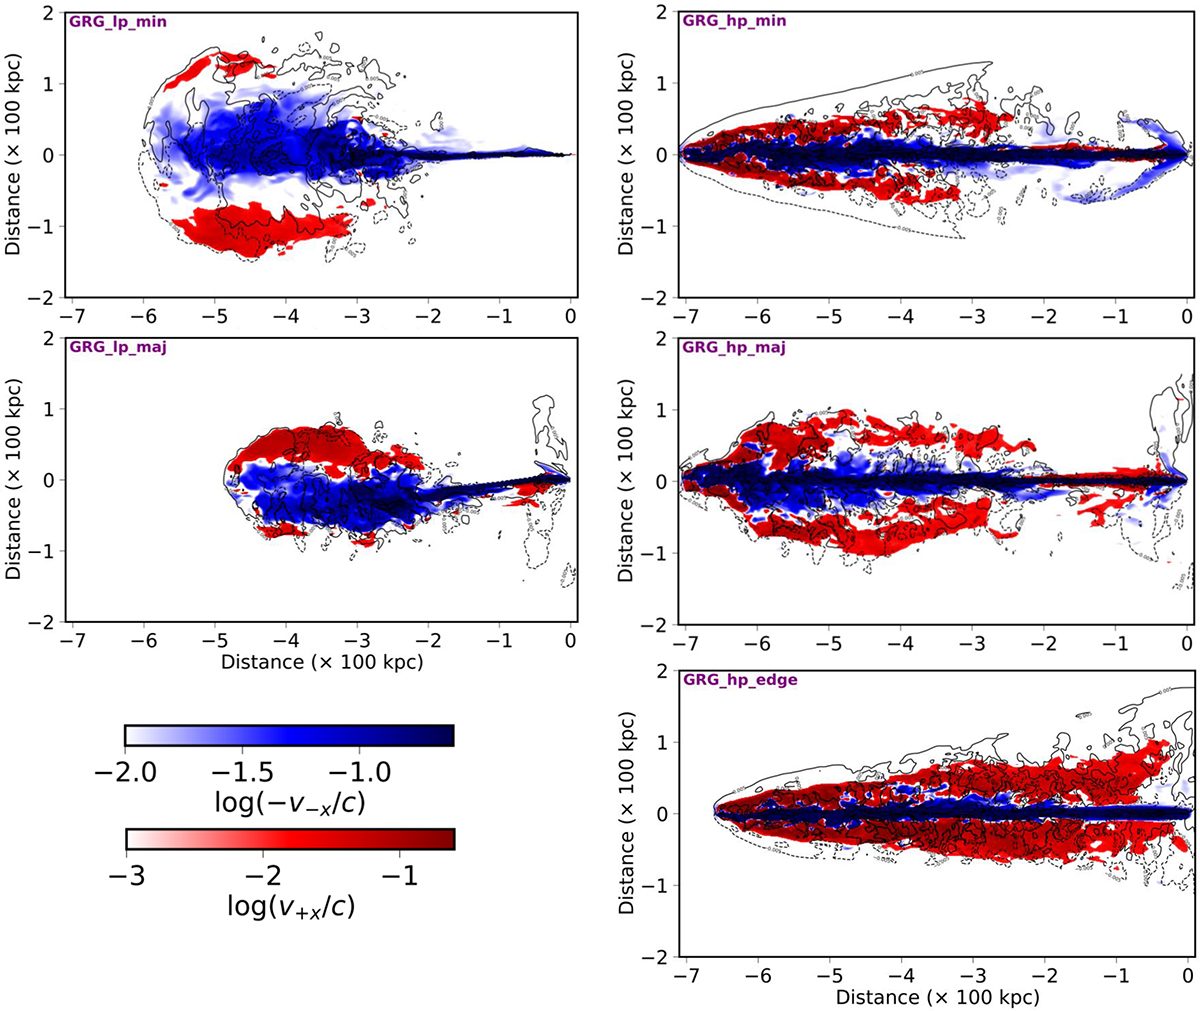
Sliced velocity maps (x − y plane, z = 0) for the resultant GRG morphologies from five simulation cases (labels indicated in each plot) illustrating the underlying matter-transport mechanisms responsible for these structures. These maps are displayed at dynamical ages of ∼167 Myr (GRG_lp_min), 196 Myr (GRG_lp_maj), 49 Myr (GRG_hp_edge), 137 Myr (GRG_hp_maj), and 69 Myr (GRG_hp_min), as also highlighted in Paper I. The colormap represents the x-component of velocity, capturing the bulk-flow (in blue) and back-flow (in red) dynamics, while the contours depict the y-component of velocity, with solid lines indicating 0.005c and dashed lines indicating −0.005c, to highlight the behavior of secondary structures forming within the domain. To analyze the impact of jet power on morphology and the influence of the tri-axial environment on the resulting structure, comparisons are made column-wise and row-wise, respectively.
Current usage metrics show cumulative count of Article Views (full-text article views including HTML views, PDF and ePub downloads, according to the available data) and Abstracts Views on Vision4Press platform.
Data correspond to usage on the plateform after 2015. The current usage metrics is available 48-96 hours after online publication and is updated daily on week days.
Initial download of the metrics may take a while.