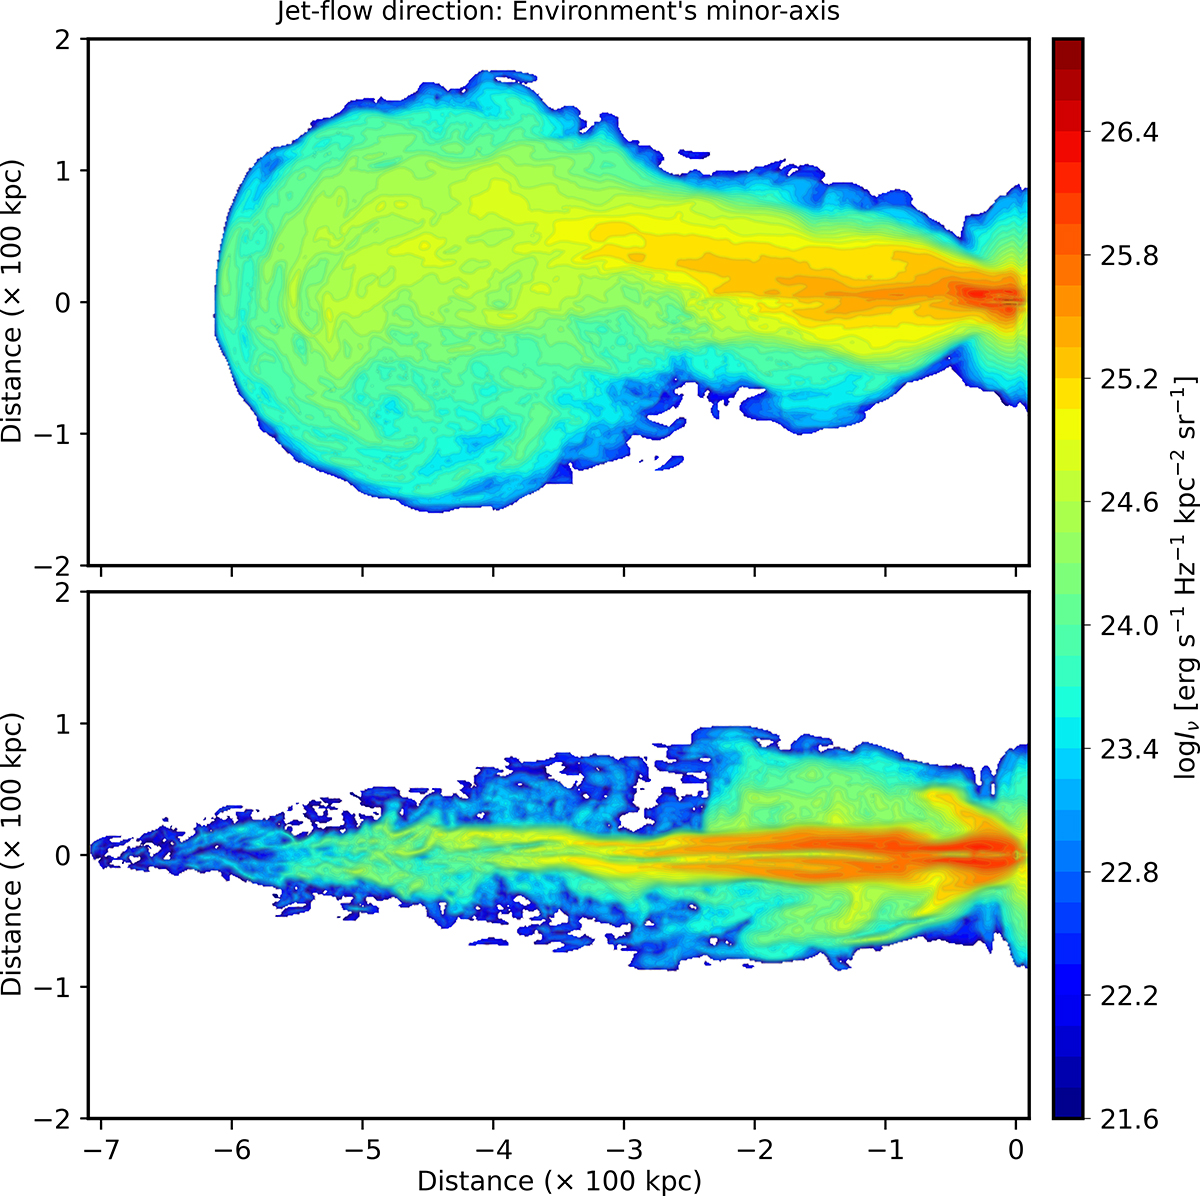
Fig. 4.
Download original image
A. Intensity maps (log Iν) at 1 GHz radio frequency for two simulation cases: a low-power jet (“GRG_lp_min”; top) and a high-power jet (“GRG_hp_min”; bottom). Both jets are propagating along the minor axis of the ambient medium. While the overall structures resemble the dynamical maps from Paper I, the emission maps offer deeper insights, highlighting crucial aspects of the observability of these simulated giant radio structures at their evolved stages (∼167 Myr: top; ∼69 Myr: bottom).
Current usage metrics show cumulative count of Article Views (full-text article views including HTML views, PDF and ePub downloads, according to the available data) and Abstracts Views on Vision4Press platform.
Data correspond to usage on the plateform after 2015. The current usage metrics is available 48-96 hours after online publication and is updated daily on week days.
Initial download of the metrics may take a while.